oh, thank you, Prakash!!!
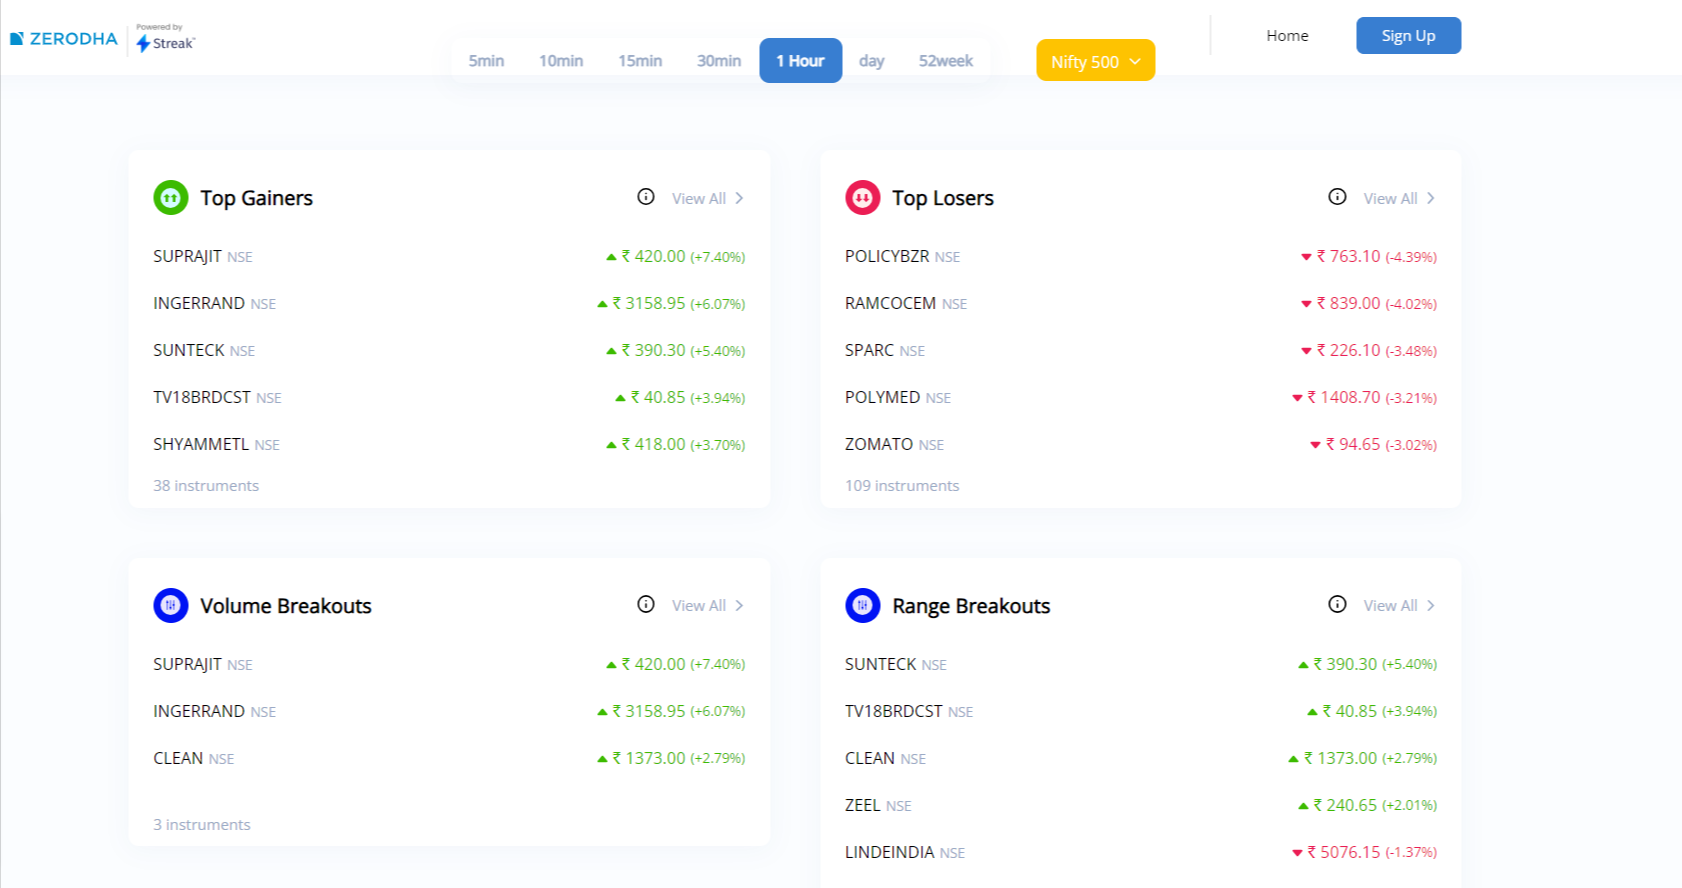
Angelone looks set for next big run

Adani ji firse ulti daud lagane chale, acche bull market ko dhakka lagwa
Apne hi dost ke public banks ko nuksan karwa diye
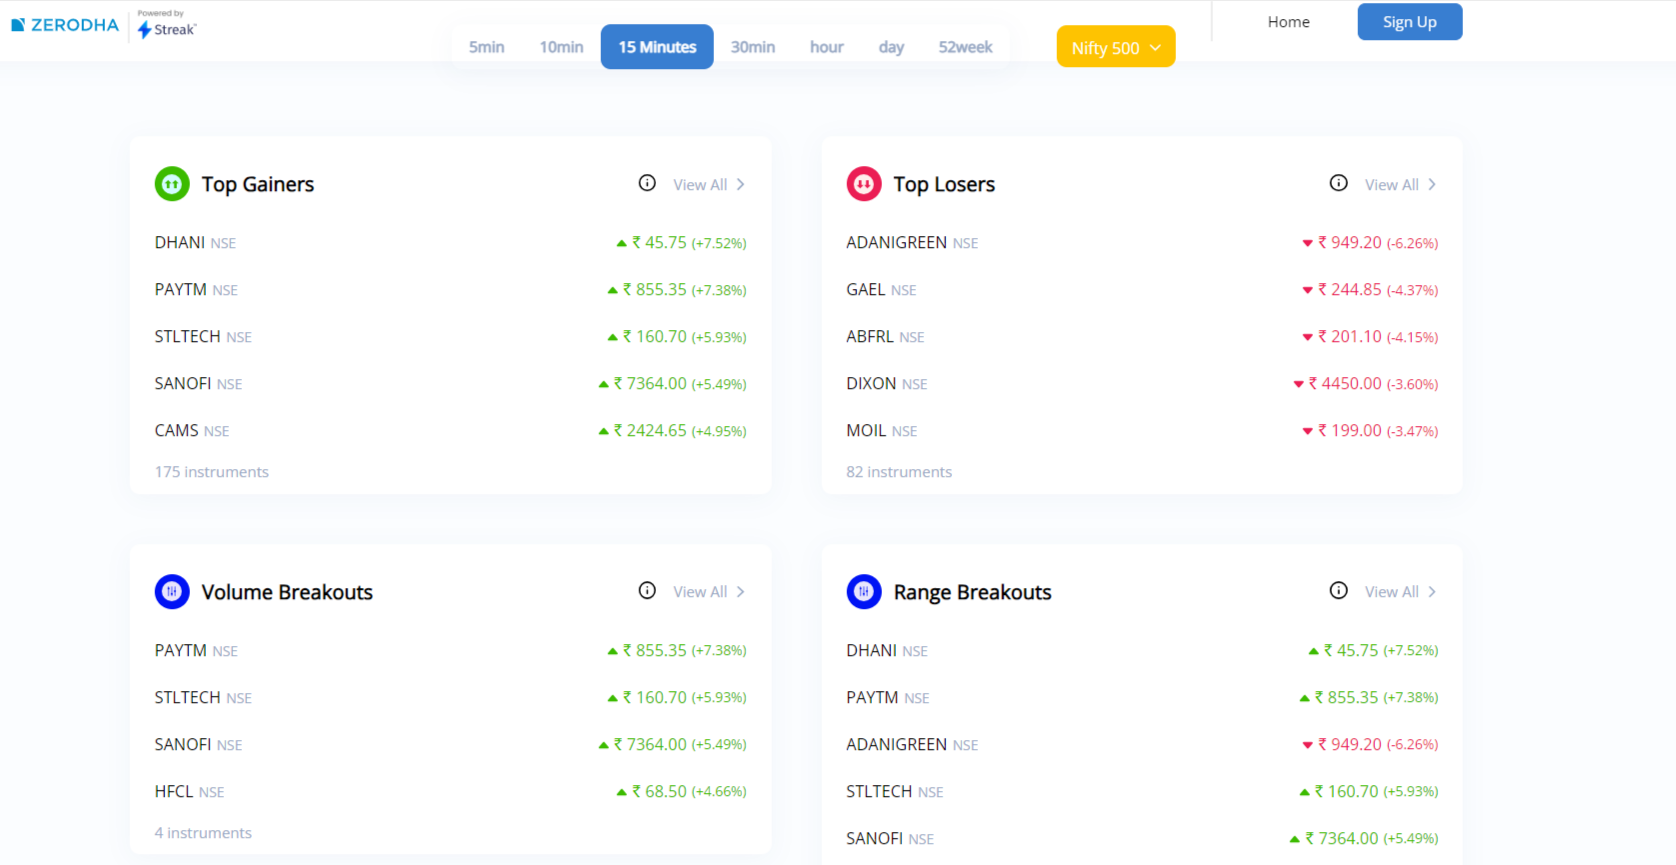
Lekin buy the dip guyss, range breakout vale stocks badhiya daud rahe hai
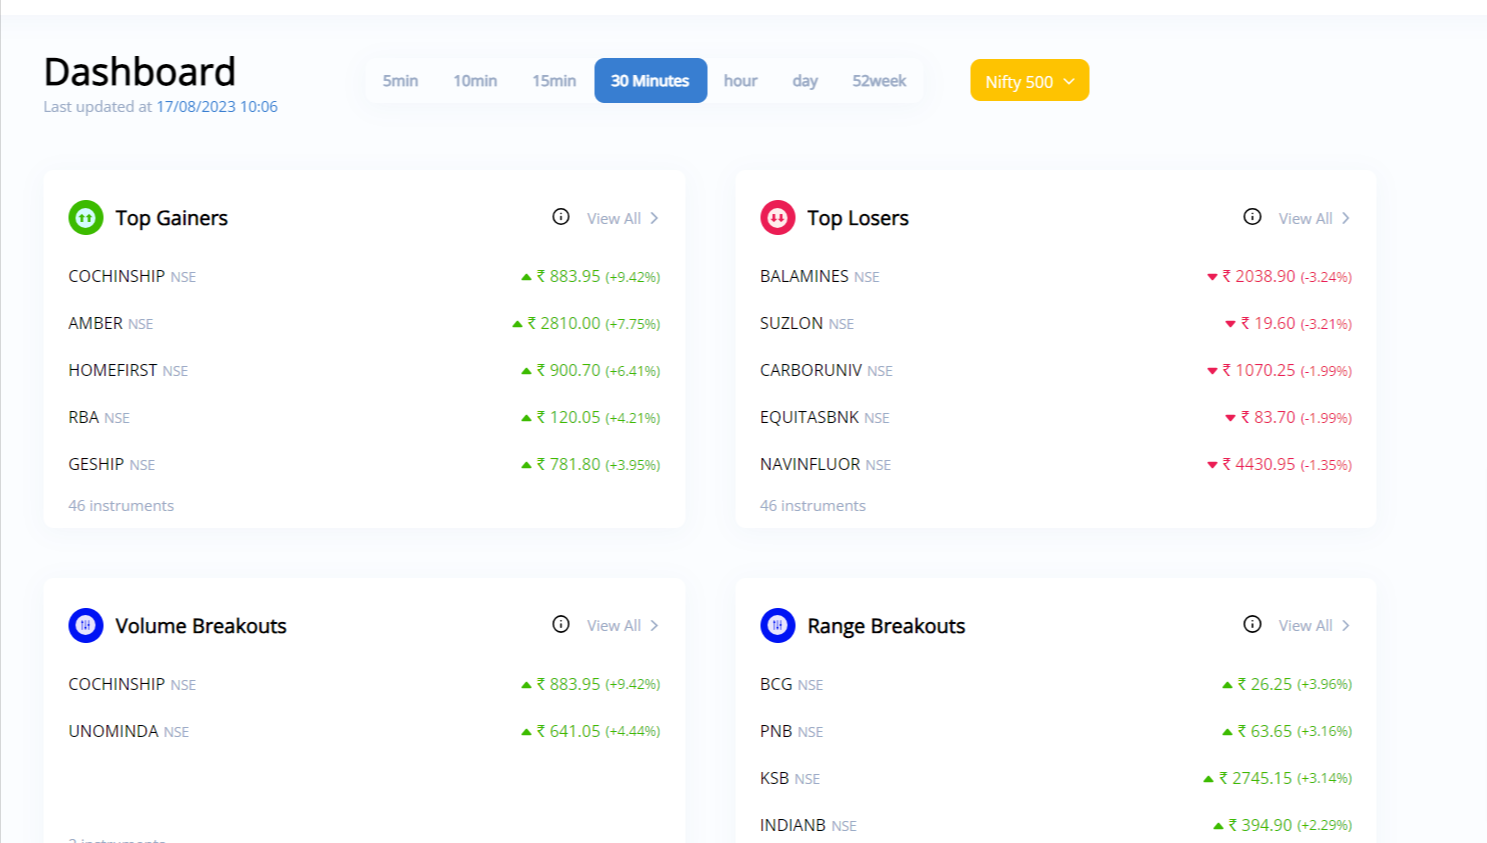

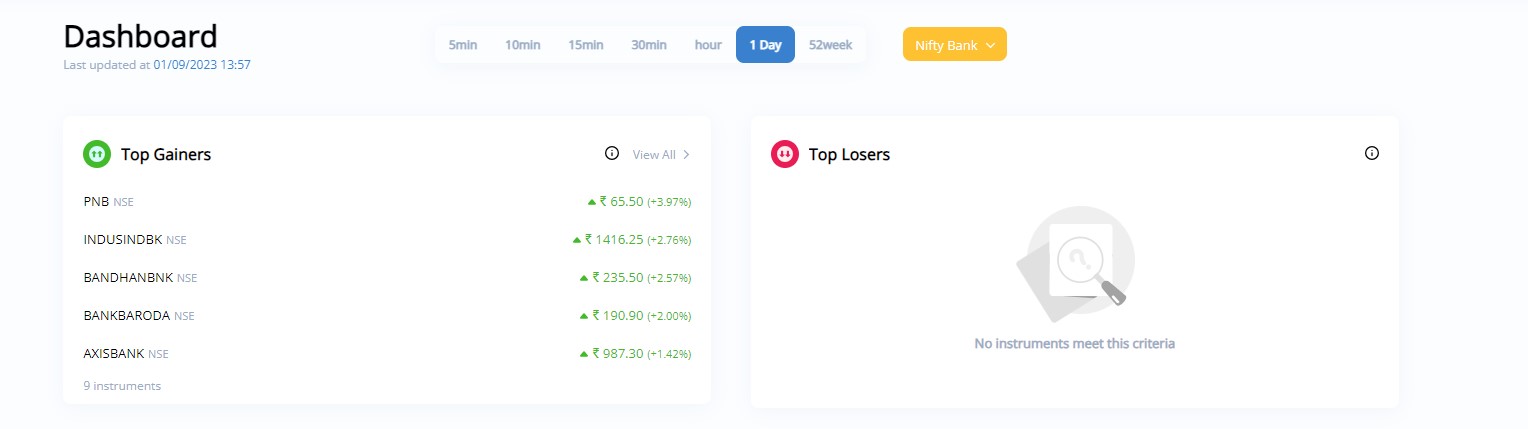
timestamp: Screenshot 2023-09-01 09:27:57
last update 8:57 then 9:27. it does not get update between this.
1 Like
Checking this. Will get back to you on this.

Checking this.
Hi @Private
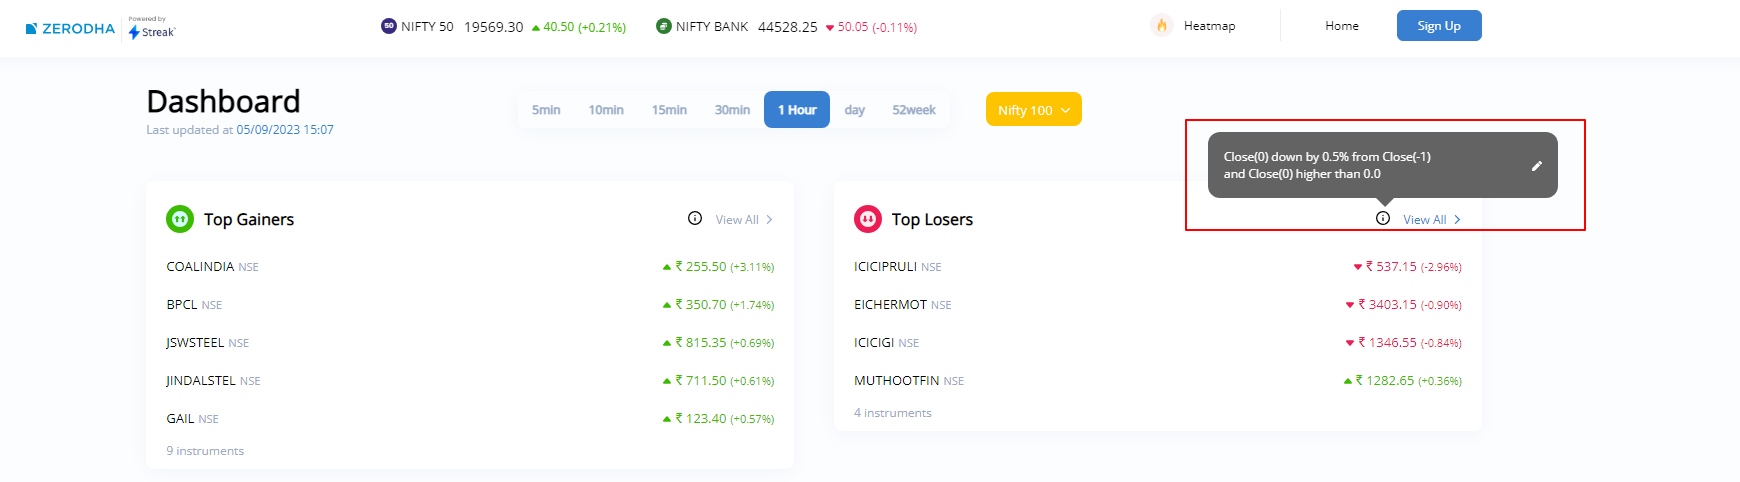
The results shown in the technicals dashboard are as per the conditons given to each section. For example, the condition to check the Top losers is Close(0) down by 0.5% from Close(-1) and Close(0) higher than 0.0. The same can be seen by hovering the mouse cursor over the “i” button you see besides the View All button.
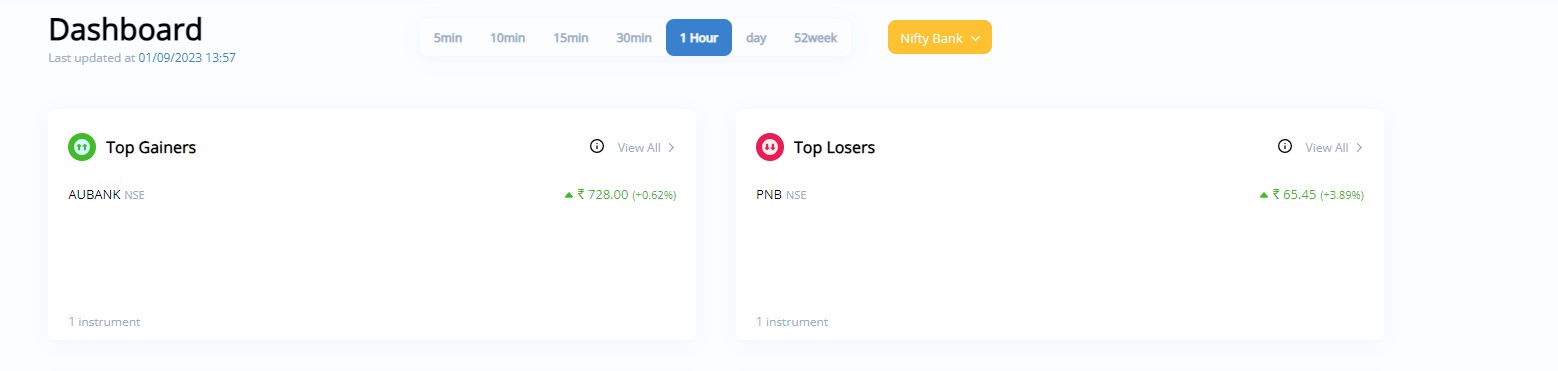
This condition will basically check if the current candle close price is down by or if there is a decrease of 0.5% from the previous candles close. In your case, as per the screenshot shared, I noticed that the last update was at 01/09/2023 13:57, which means that the previous 1hour candle was the 12:15 - 13:15 1hour candle.
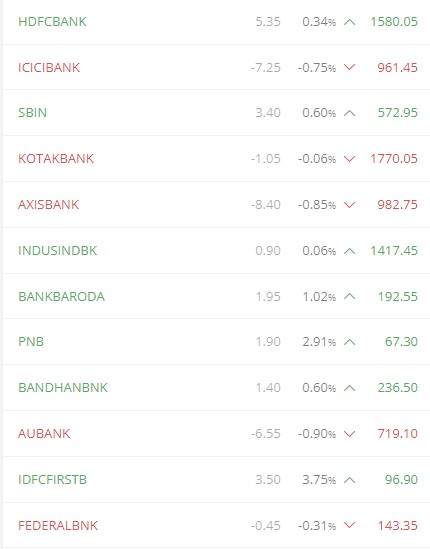
Now, when we consider the price of the 13:57 1min candle we will notice that it was down by more than 0.5% from the previous 1 hour candle close (i.e. the 12:15 1hour candle close) due to which the PNB stock was showing in the Top Losers section. You can refer to the below image to view the same.
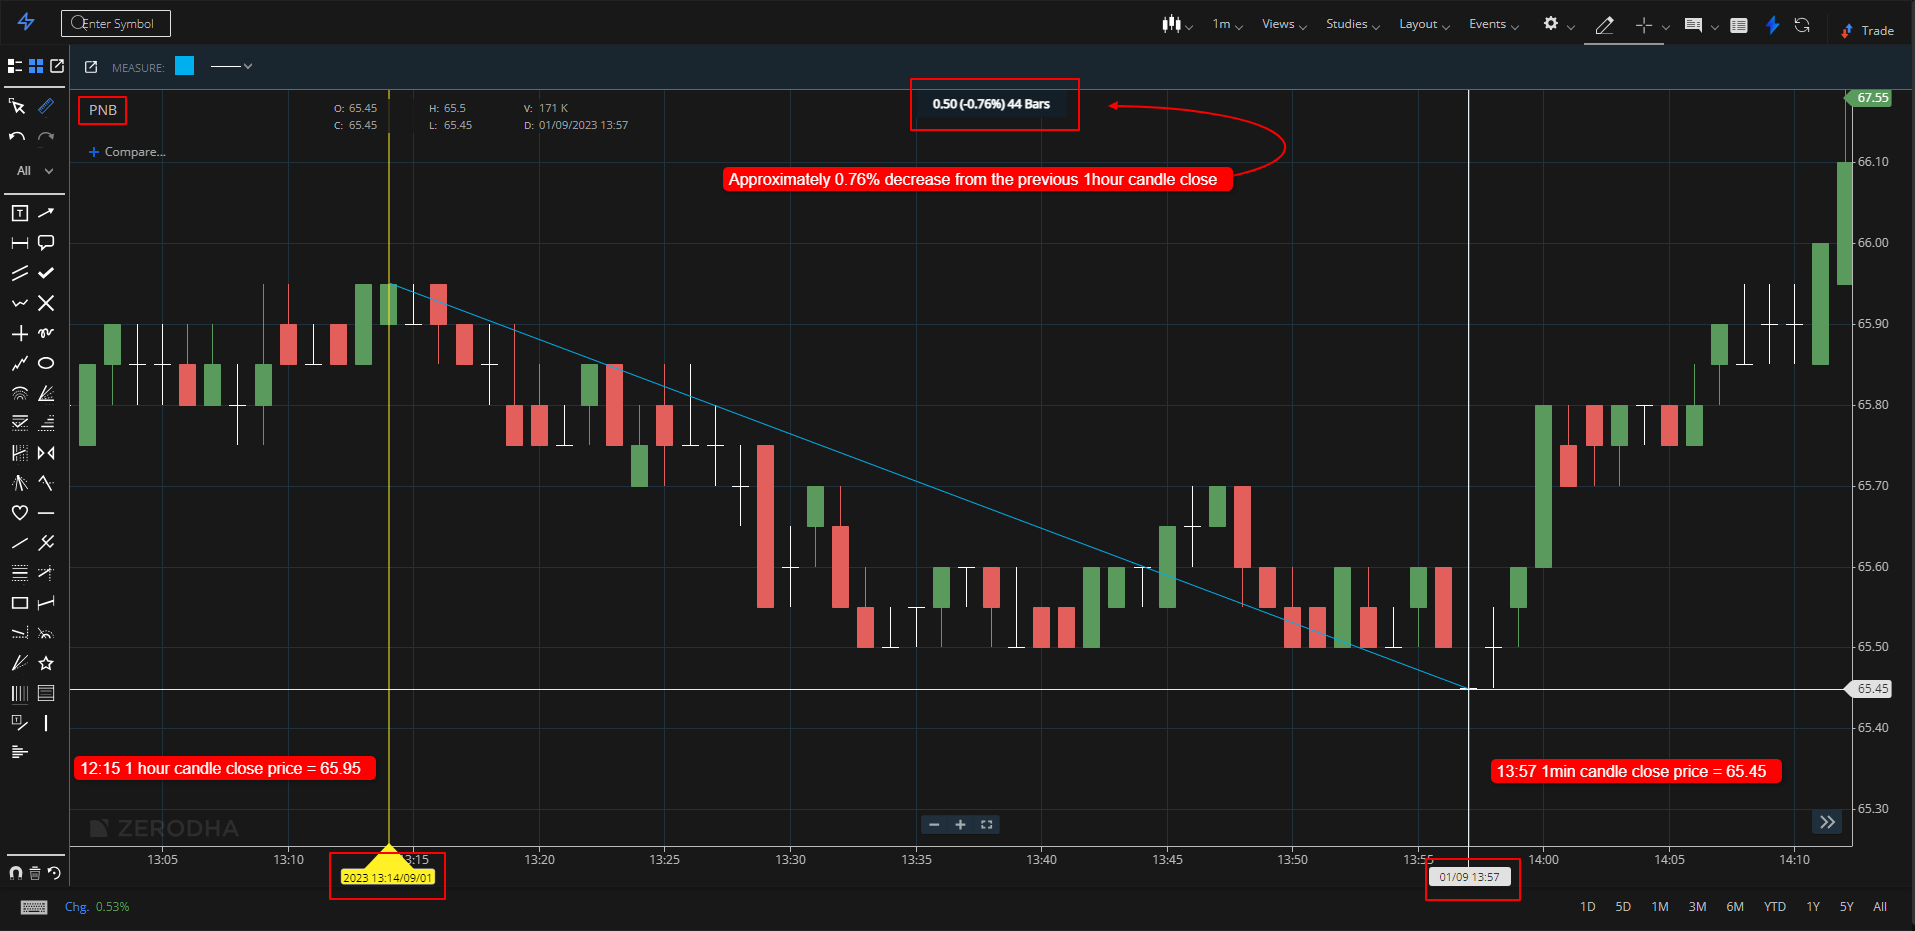
In the above image I have marked the 13:14(Yellow line) and the 13:57(White line) 1min candles and have used the measure tool(Blue slant line) to calculate the fall in the price. You can notice that the price has fallen by around 0.76% due to which the dashboard was showing PNB in the Top losers section.
It should be noted that all the sections i.e. Top Gainers, Top losers, Volume Breakouts, etc are based on some conditions. And these conditions will be checked on the selected timeframes.
Hope this clarifies.
1 Like