Introducing technicals dashboard

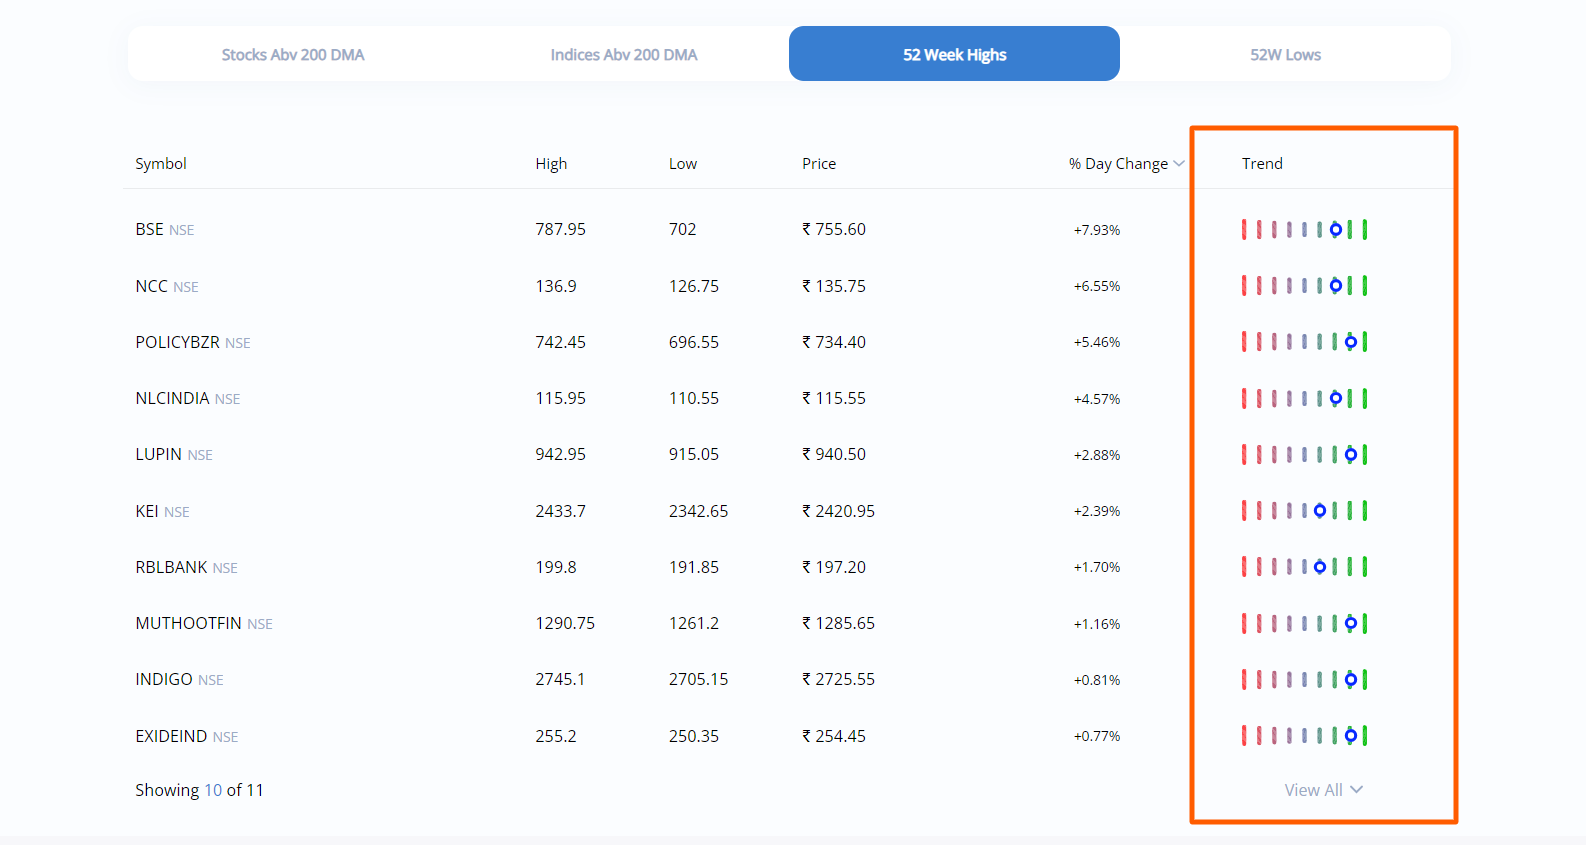
An option to check top gainers and losers and other such technical data is one of the most common requests we get. We’re introducing a technicals dashboard powered by @Streak, where you can check market data like Top Gainers and Losers, Heatmap, Volume and Range Breakout, Advance Decline Ratio, and list of stocks and indices trading above 200 DMA along with stocks at 52-week highs and lows.

You can access the technicals dashboard at technicals.zerodha.com.

Quick overview of main data points available on the technicals dashboard

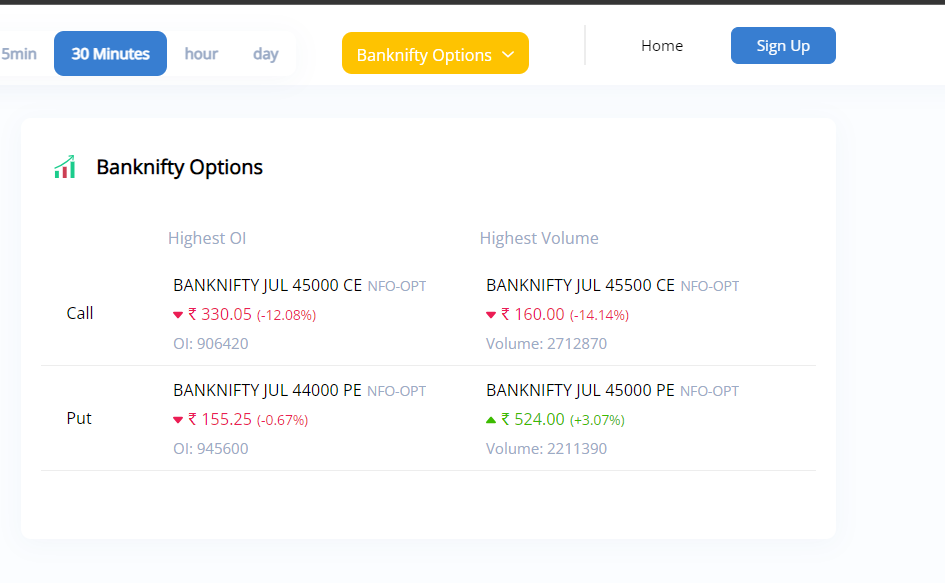
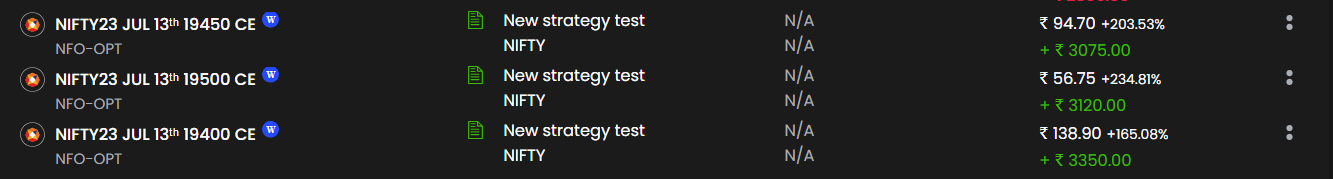
Top Gainers & Losers and Volume and Range Breakout

You can check top Gainers and losers for indices like Nifty 50, Nifty 100, Nifty 500, Bank Nifty, etc. Along with this, you can also check gainers and losers specifically amongst F&O stocks, across time frames of 5, 10, 15, 30 minutes, 1 hour, 1 day, and 52 weeks.

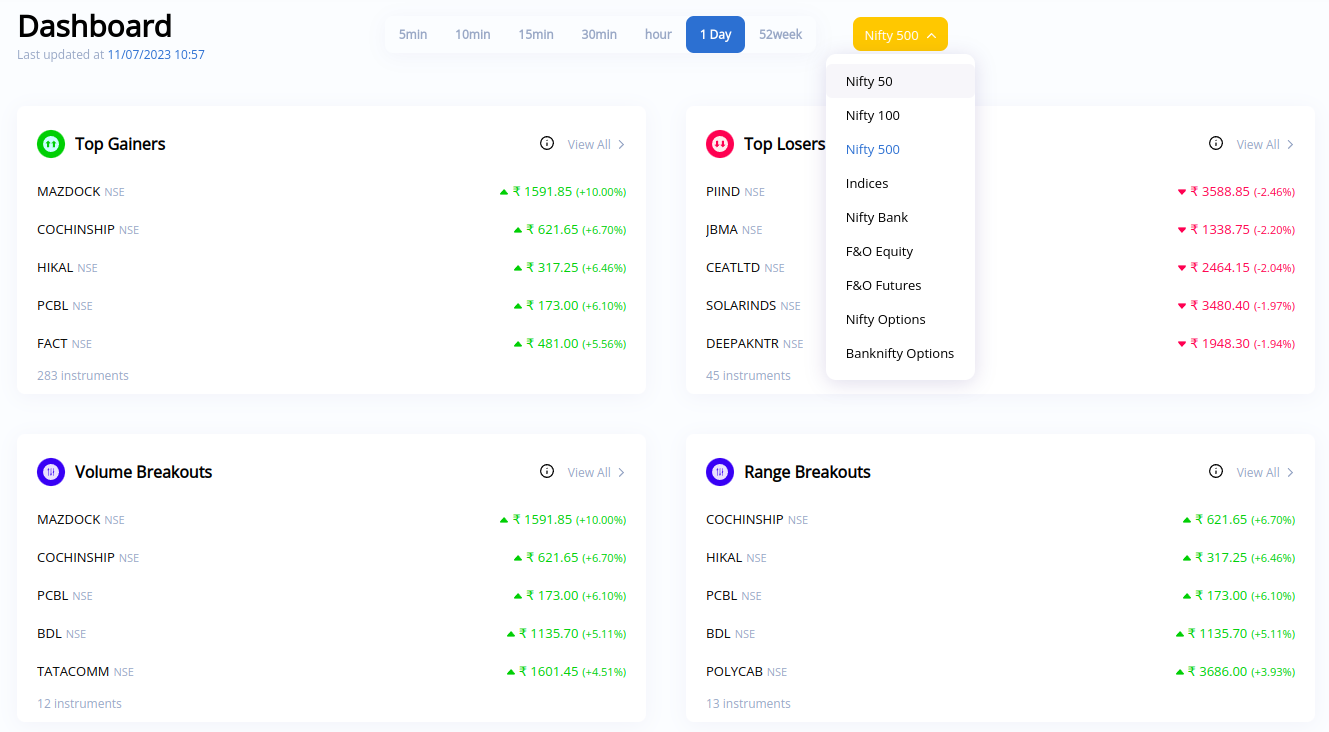
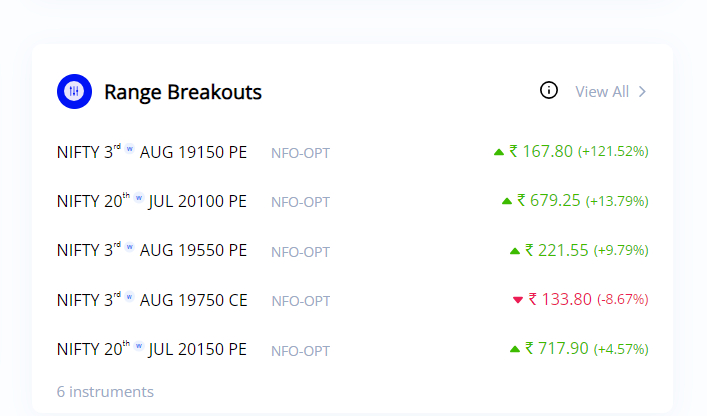
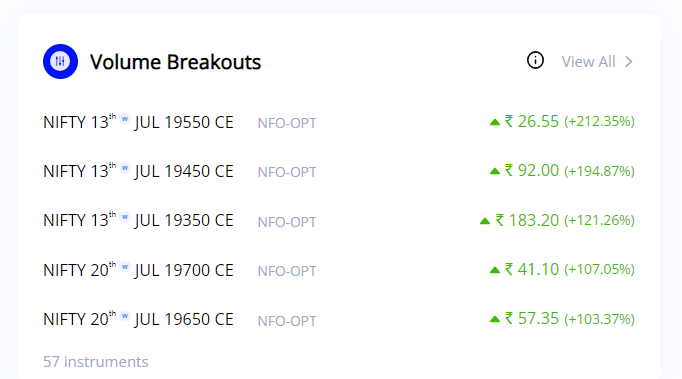
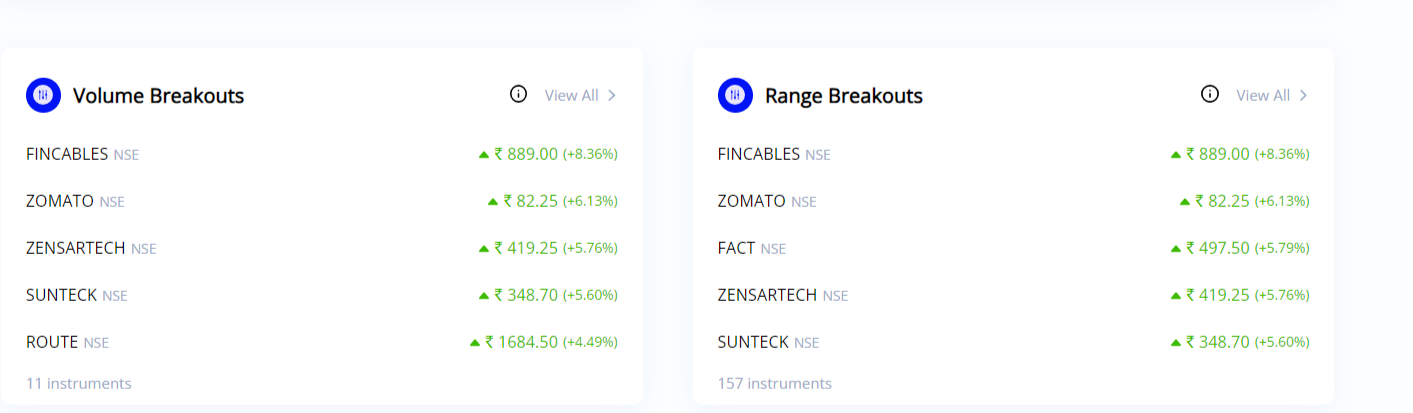
Along with top gainers and losers, you can check Volume Breakouts and Range Breakouts for stocks, futures, or options contracts.
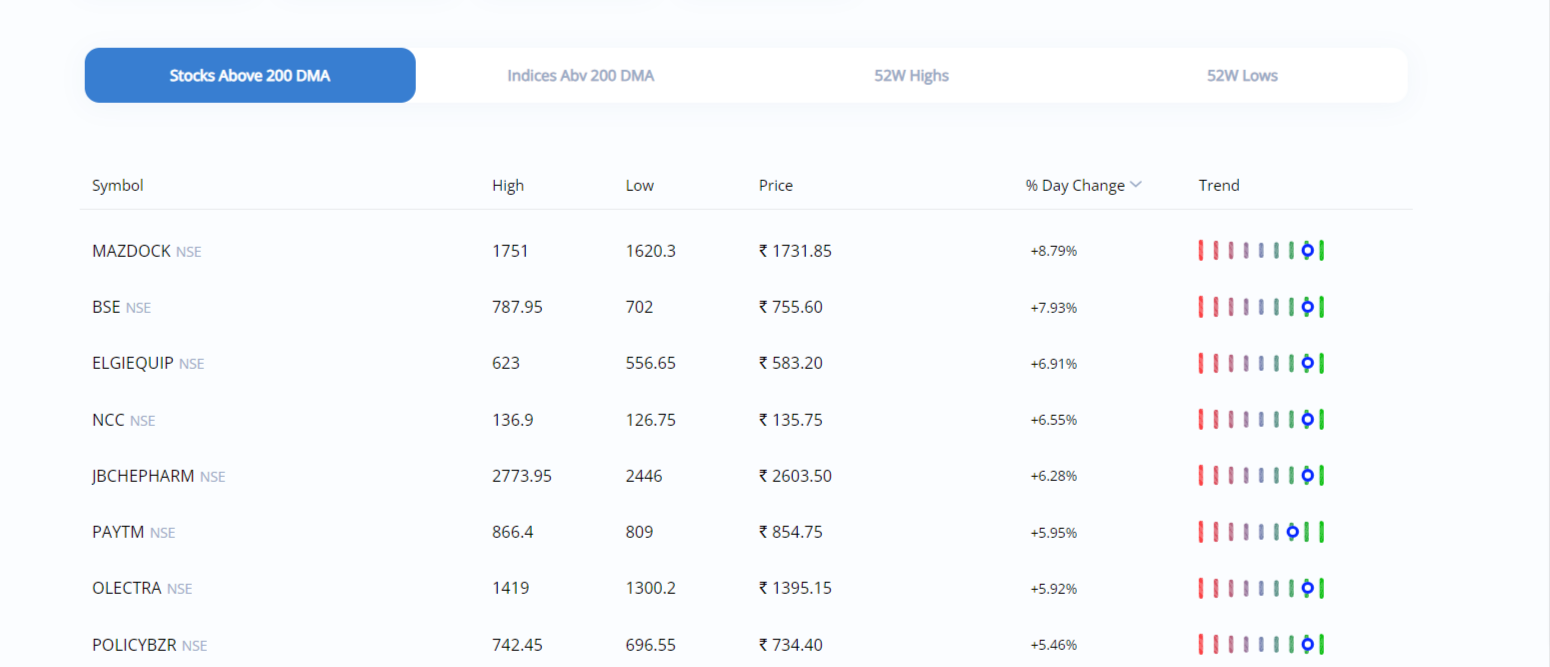
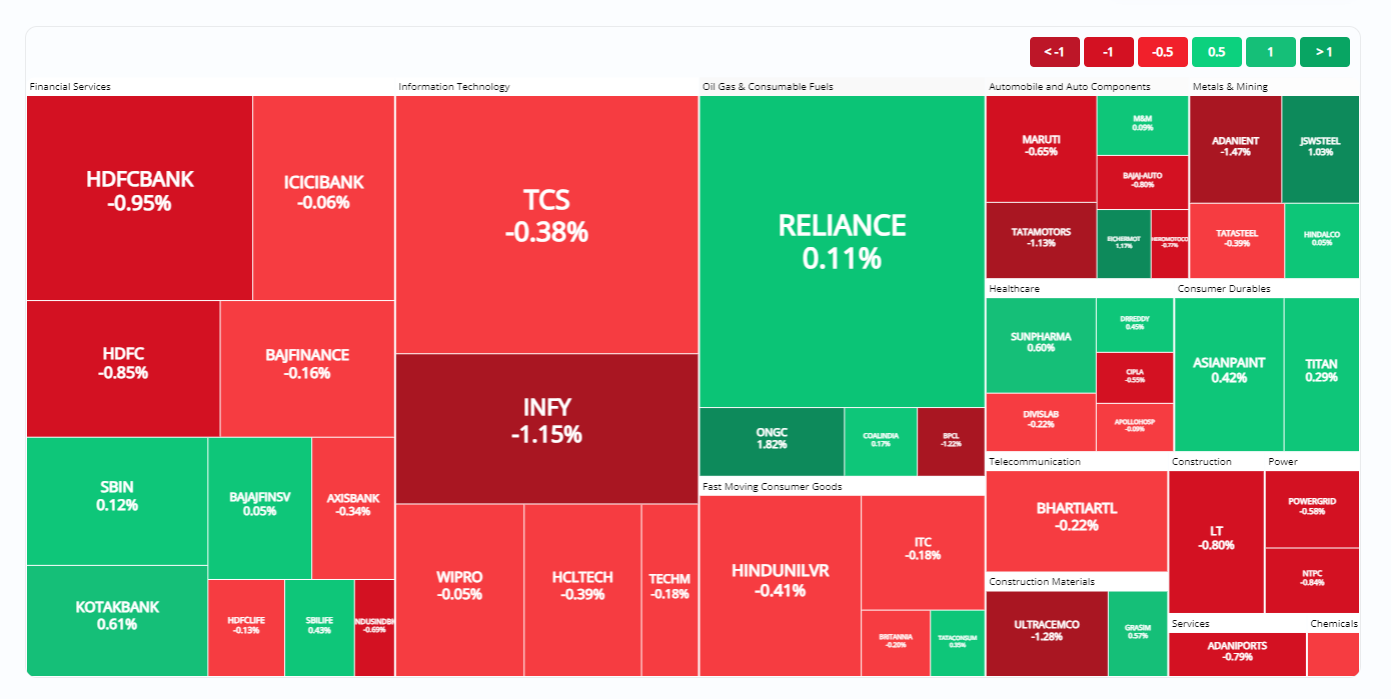
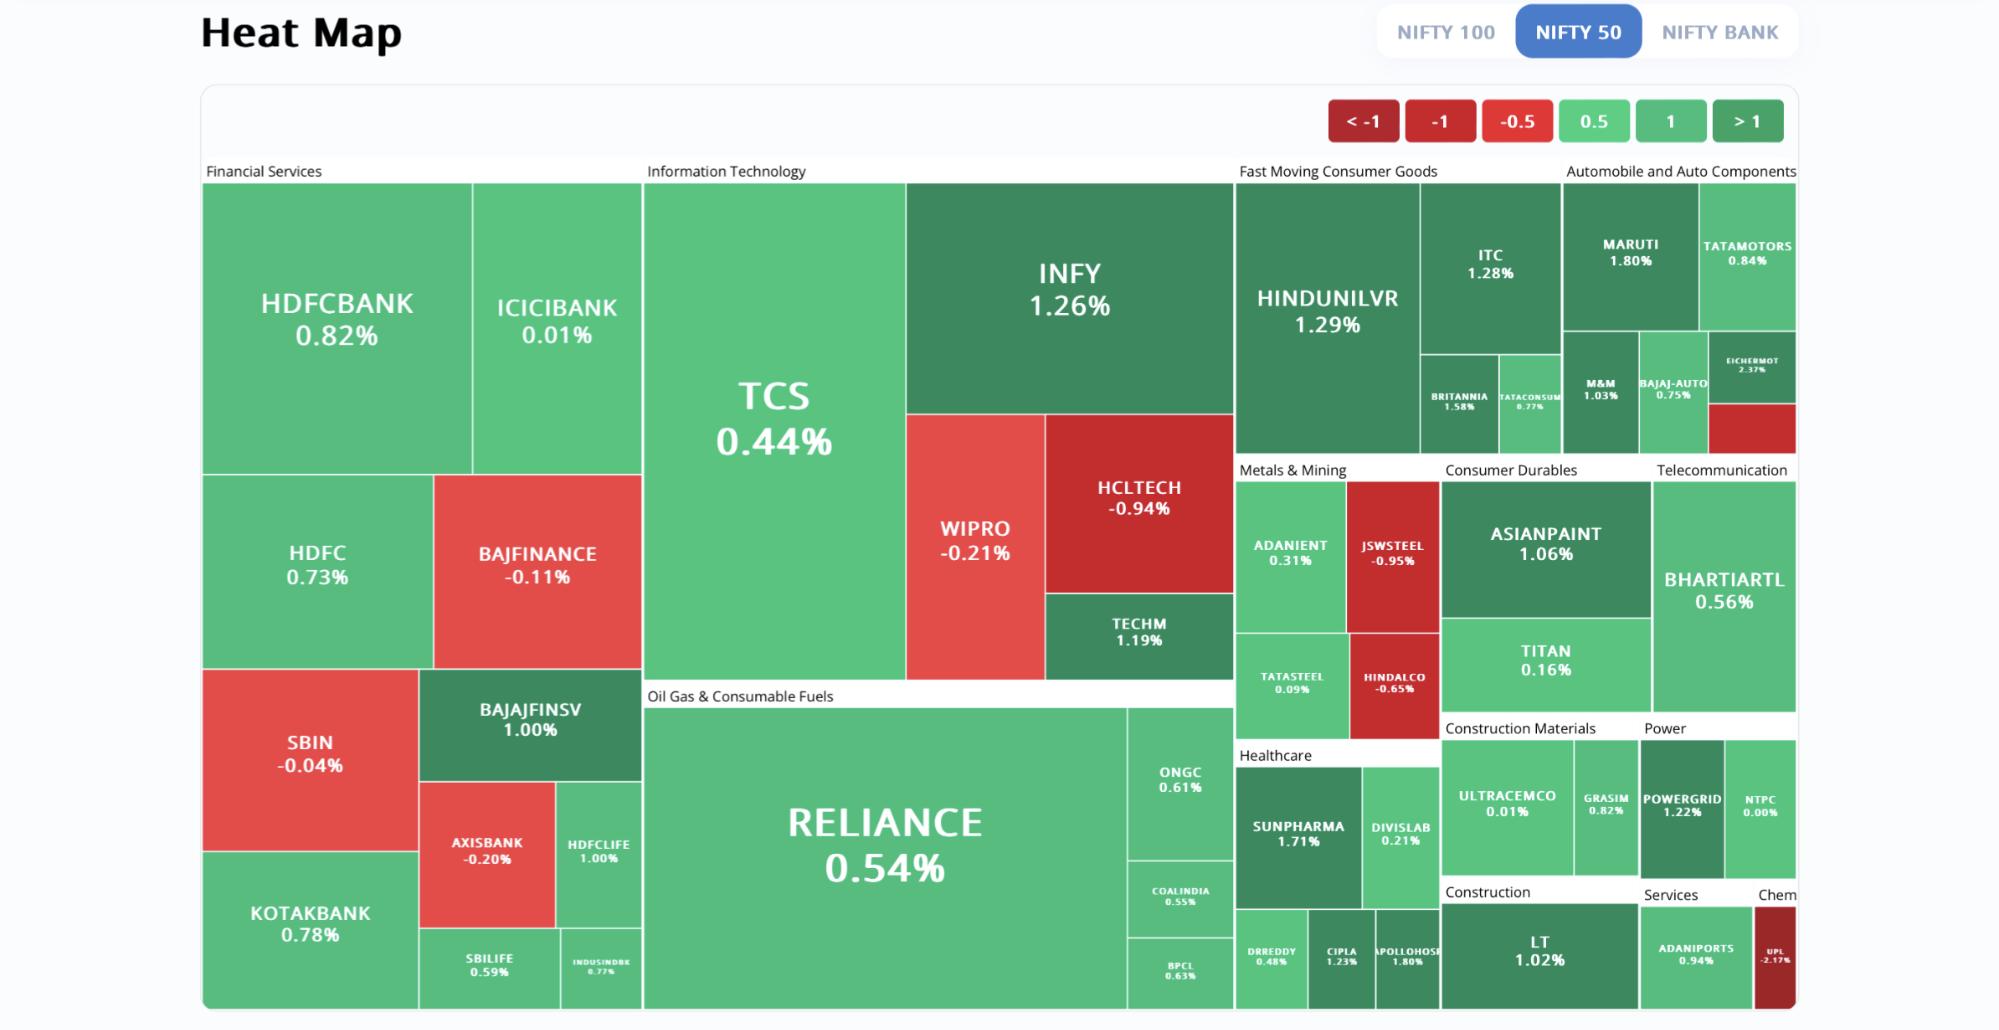
Heatmap

Heatmap shows you a quick overview of how the stocks in the select index are performing. Heatmap is available for the Nifty 50, Nifty 100, and Bank Nifty indexes.

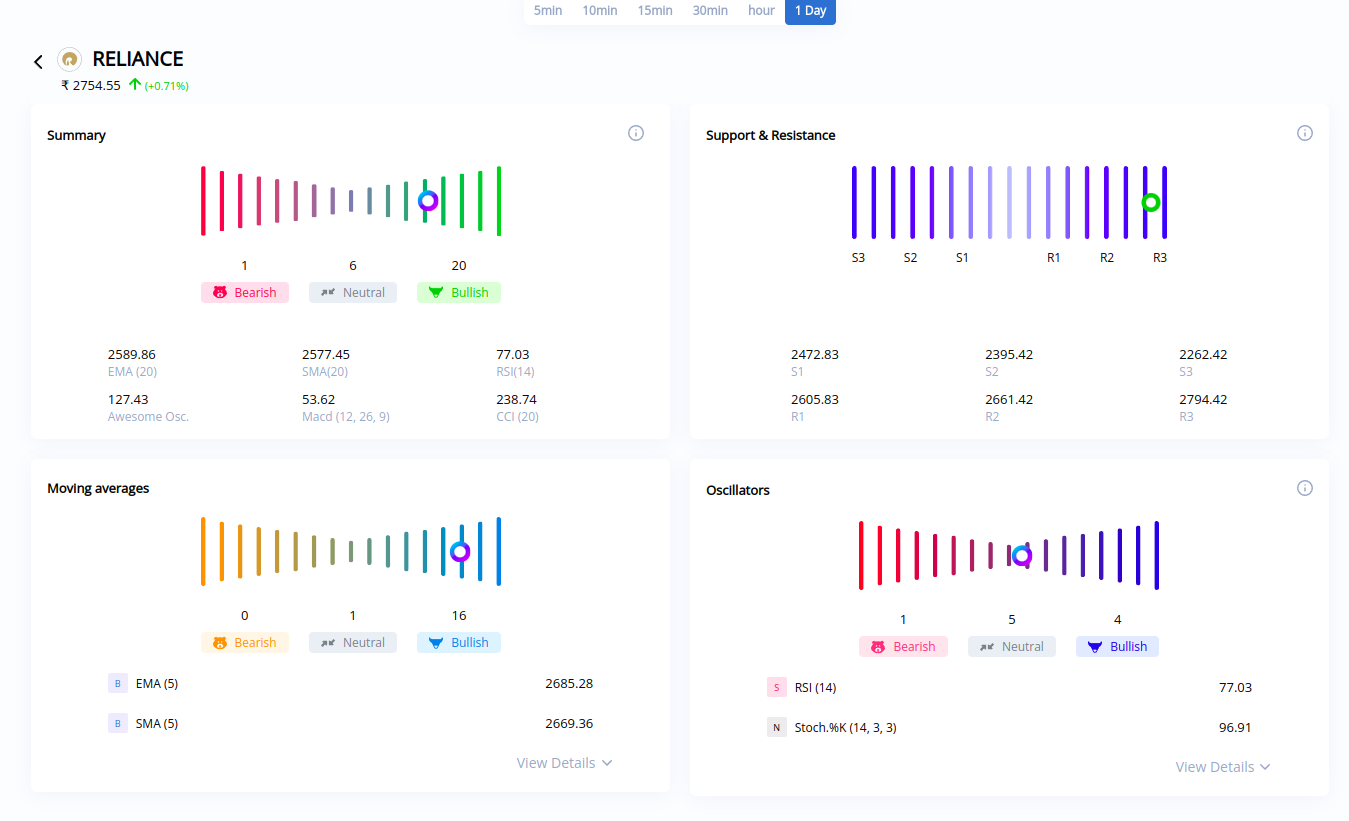
You can click on any stock in the list to check the summary and sentiment based on Technicals for that specific stock;

You can also access the technicals dashboard from Kite

On Kite app:

  1. Tap on any scrip
  2. Tap on Technicals and then on Market Technicals

ezgif.com-optimize

Here’s how you can access the Market Technicals dashboard from Kite web;

Kite web technicalss

Note: The data is refreshed every 5 minutes.

21 Likes

Looks Amazing!! Getting a glance at the whole market on one page! love this new update :heart:

1 Like


wow great!!! Always love the new feature addition of Kite and here’s another powerful tool in the hands of retail traders. Good going @Streak

1 Like

Highest OI and Highest Volume strikes are directly shown, awesome! No need to manually find these on the option chain now :smile:

1 Like

Hi team, love this new page! Kudos to Kite and Streak. The above part i really liked, “trend”, stocks which are making 52week, i can immediately understand KEI and RBLbank trend strength is not that good, am i correct?

Do share some links or details on this technical tool, seems very interesting :100:

This helps a lot !! Really wanted a dashboard for options as I am doing options buying these days.

This was released at the right time for me. Thanks, Kite and Streak team. :heart:

3 Likes

Agreed @Chirayu08… I have a strategy on Nifty Bank and Nifty 50 stocks, so I also check how the sector is performing before taking a trade. I was going on the NSE site to view the data but here the heat map gives an overall picture of the sector. So job made easy I’d say.

Is it free or do I need to pay to use this?

Great job guys this is much use full. I literally trade on Volume breakout stocks every day its nice that all time frame all segment volume breakout is there in one place. :clap: :clap:

@ShubhS9 Quite simple and straight forward… Nice addition

Is it realtime?

Looks like it’s free for public use. I dont see any pricing on the website.

Took the help of the options analytics (volume breakouts) for today’s paper trade and the decision turned out to be good.

image

Really good and helpful product :heart:

This is free to use.

2 Likes

absolutely free!!

2 Likes


Ahhh absolute treasure of information for a swing trader like me!

1 Like

This product is awesome🔥

Lets say the BNF heatmap is all green it makes sense to buy BNF ?? Any expert advice ?

Hope to see the integration with Kite page soon that will make it easy.

Makes Sense bro.
Not a expert though :sweat_smile:

The data is updated every 5 minutes.

1 Like