Hi,
Today I found one post on Twitter post iron fly in which max loss is also positive.Sharing some images of Payoff Graph shared by users.
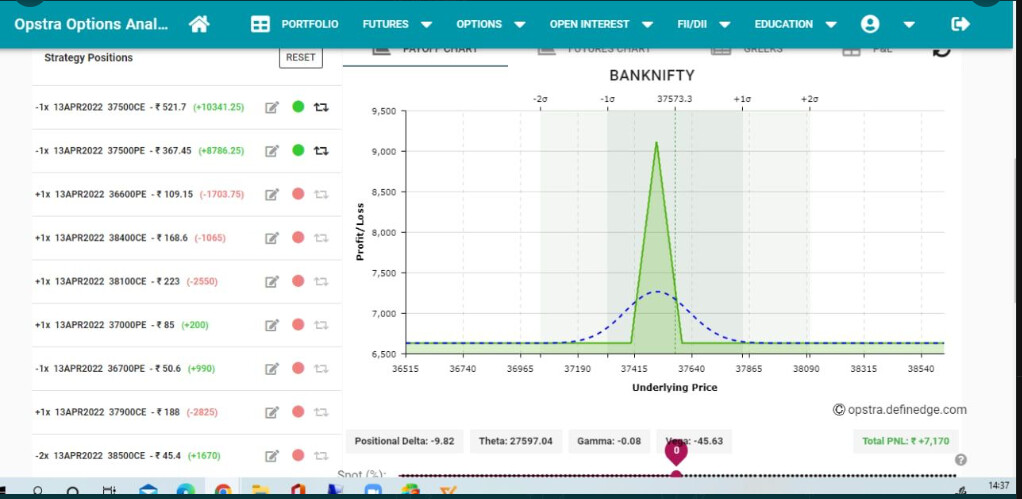
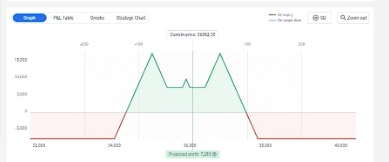
Snap 1-
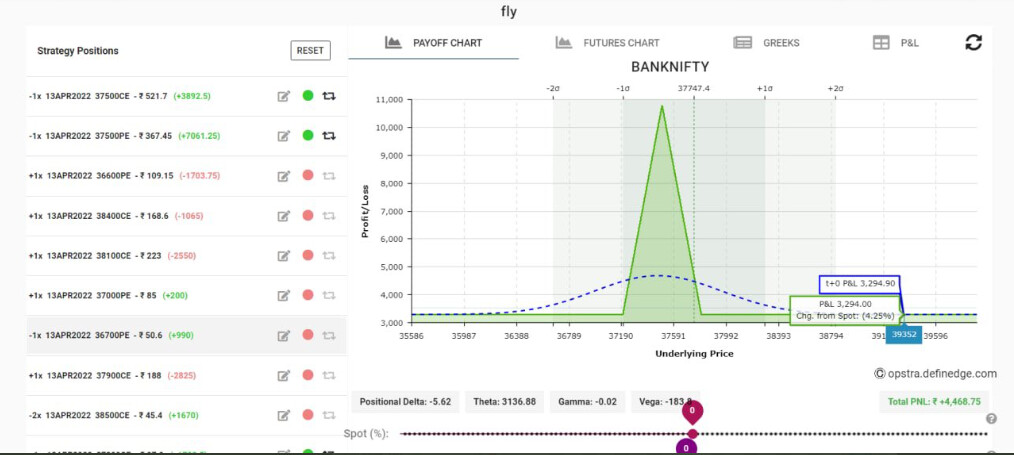
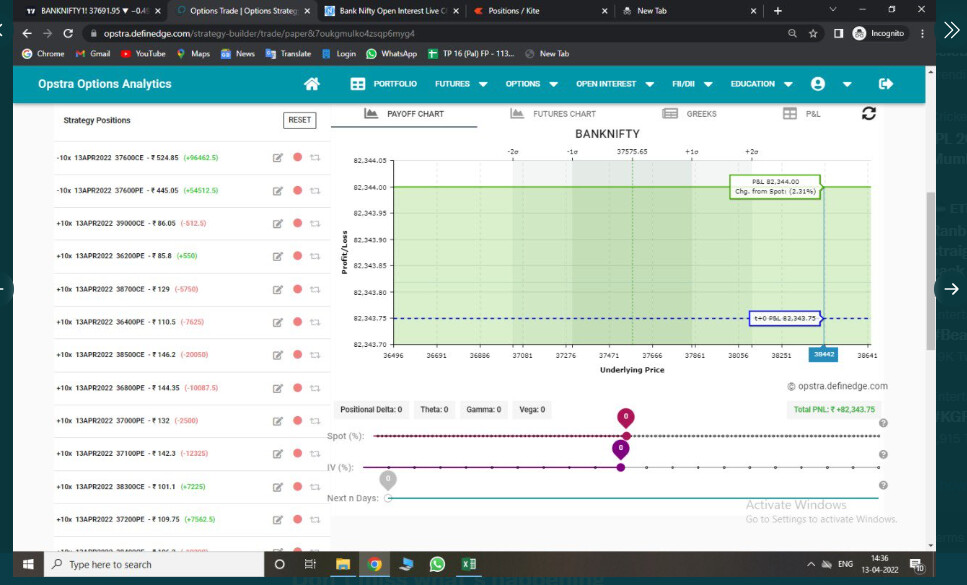
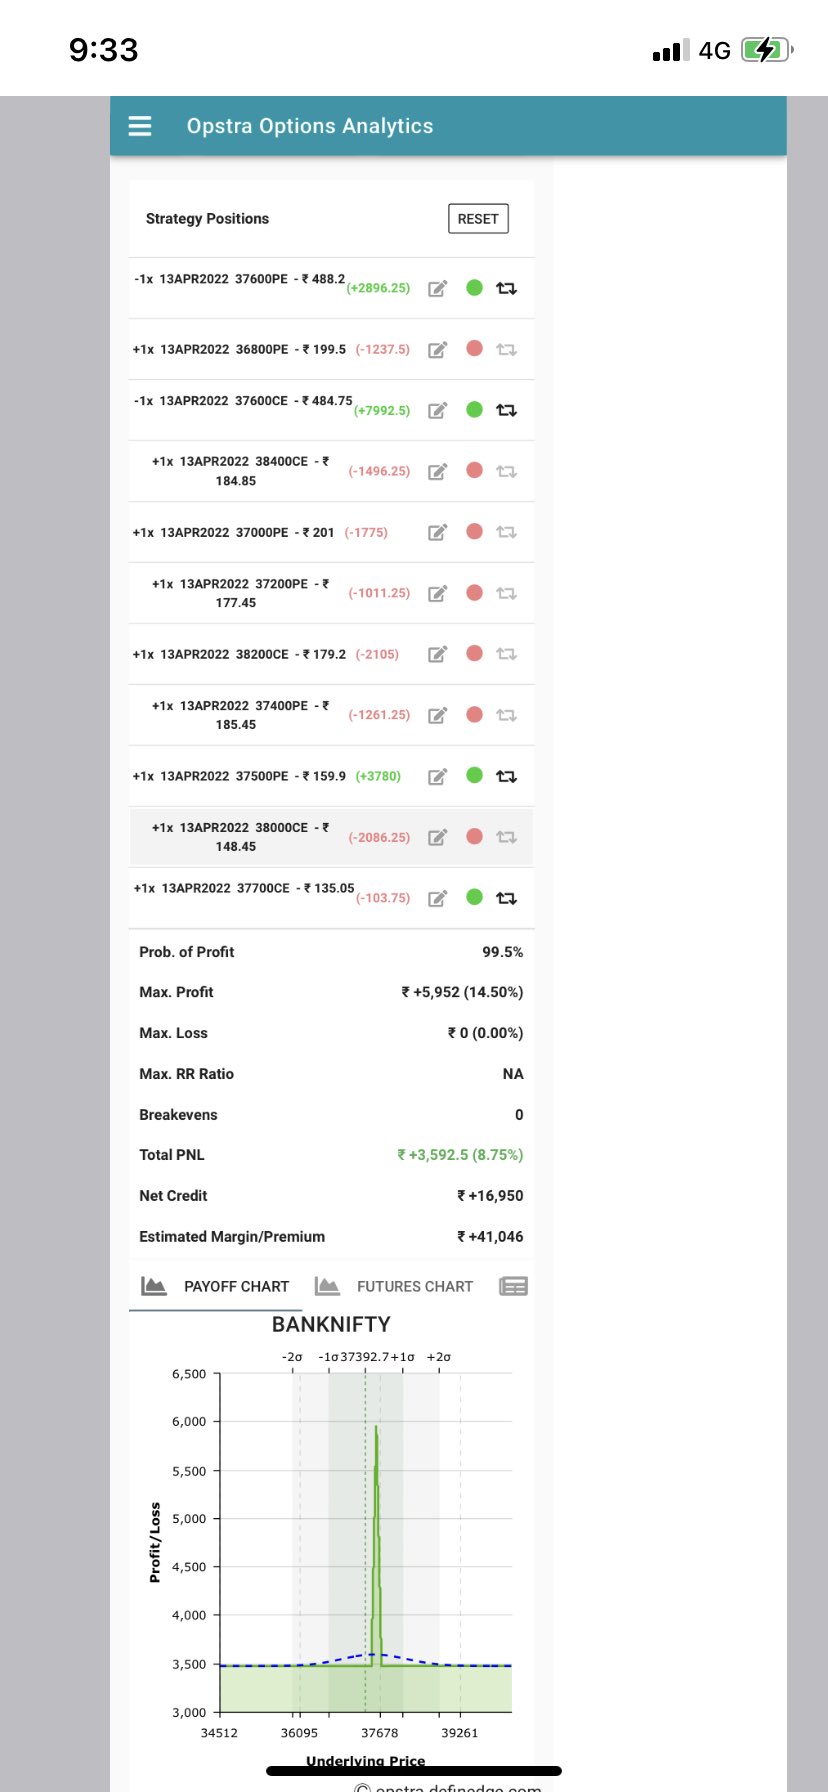
Snap 2-
Snap 3-
In All 3 Snaps P&L both are positive,as this was first time for me to find such strategy where P&L both are positive , it was hard to believed for me. As Snap 1 was incomplete by user so I cannot decode the trades.
I tried decoding the trades taken in Snap 2 having P&L positive. The Screenshot of Snap 2 is taken on Date 12 APR 2022 9:33 AM.
Total 11 trades are taken to get the payoff graph in snap 2. All trades are of same expiry 13 APR 2022.
Based on prices of options/trades in snape2 I am able to get the timing of Trades are executed.
First 5 Trades are exectued on 8 APR 2022 9:20AM.
Date	4/8/2022  9:20AM
Particular	Value
Script	BNF
Spot Price	37600
CE Strike, Sell	37600
PE Strike, Sell	37600
CE Strike, Buy	38400
PE Strike, Buy	36800
PE Strike, Buy	37000
CE Premium received for short	484
PE Premium received for short	488
CE Premium paid for Long	184
PE Premium paid for Long	199
PE Premium paid for Long	201
On next Day 11 APR 2022 9:20 AM, two trades/options are added as below.
Date        11/4/2022  9:20AM
CE Strike, Buy   38200
PE Strike, Buy   37200

CE Premium paid for Long   179
PE Premium paid for Long   177
on Same Day 11 APR 2022 at 1 PM, two more options are added.
PE Strike, Buy   37500
PE Strike, Buy   37400

PE Premium paid for Long   185
PE Premium paid for Long   160
On Next Day means “Today”, 12 APR 2022 9:15AM , Two more Options/Trades are added.
CE Strike, Buy    37700
CE Strike, Buy    38000

CE Premium paid for Long   135
CE Premium paid for Long   149
I checked Net Debit/Credit and P&L of all options till today 11 APR EOD (3:30 PM).
I found Net Debit is Negative and P&L for this strategy gone negative currently… But in Opstra Payoff Graph showing Net loss in +ve Rupees which is contradicting the option prices.
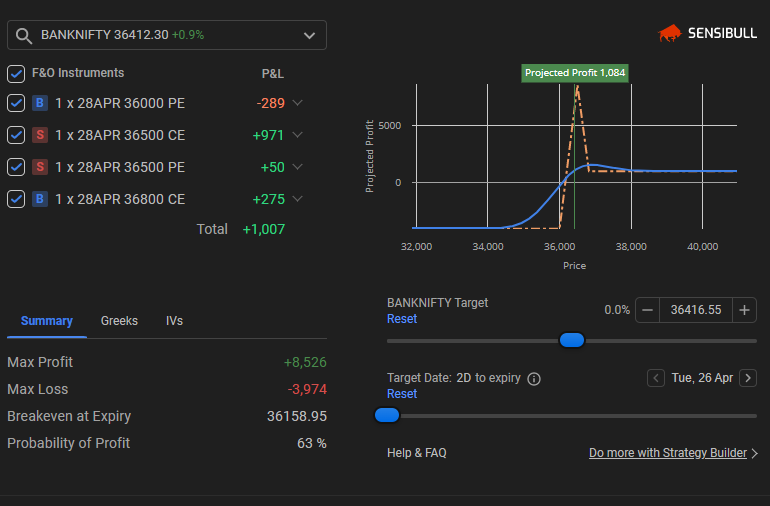
Can anyone check this strategy in @Sensibull for payoff graph and do let me know if there exist any strategy where P&L Both are positive.
Trades for 13 APR Expiry BNF	Premium in Points
37600 CE	488
37600 PE	484
38400 CE	-184
36800 PE	-199
37000 PE	-201
38200 CE	-179
37200 PE	-177
37500 PE	-160
37400 PE	-185
37700 CE	-135
38000 CE	-149
Net Debit	-448
P&L in Rs
12/04/2022 EOD

Trades    	P&L
37600 CE	4975
37600 PE	9225
38400 CE	-4150
36800 PE	-4625
37000 PE	-4575
38200 CE	-3575
37200 PE	-3625
37500 PE	-1875
37400 PE	-3175
37700 CE	2000
38000 CE	-1450
Net Debit	-10850
Other Payoff Graphs-
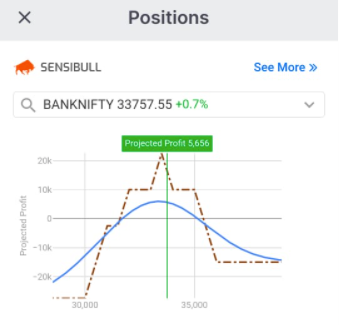
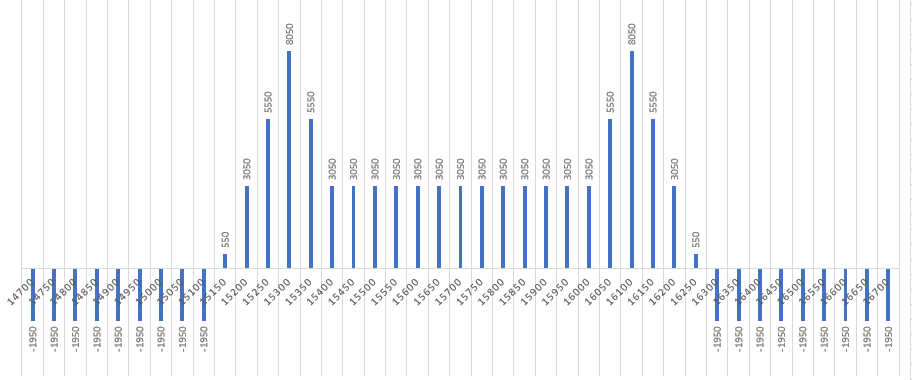
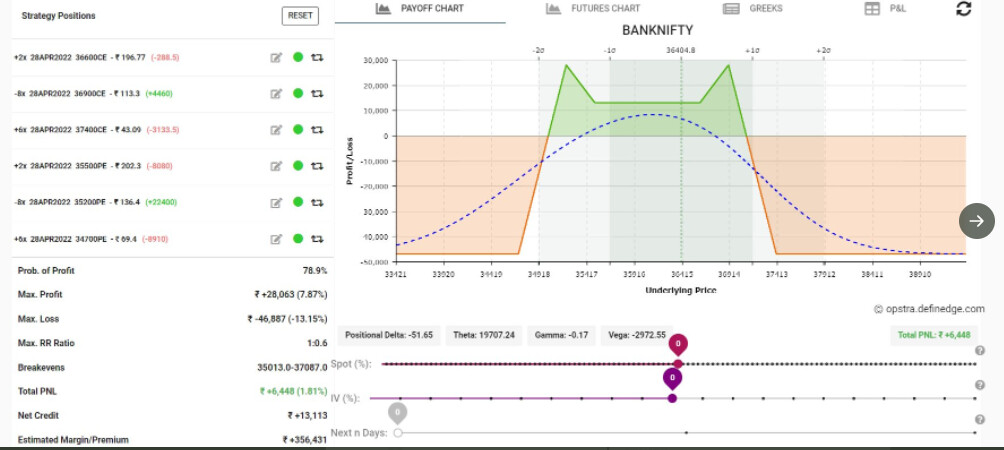
BatMan Payoff graph by twitter.com/dtbhat
Snap-
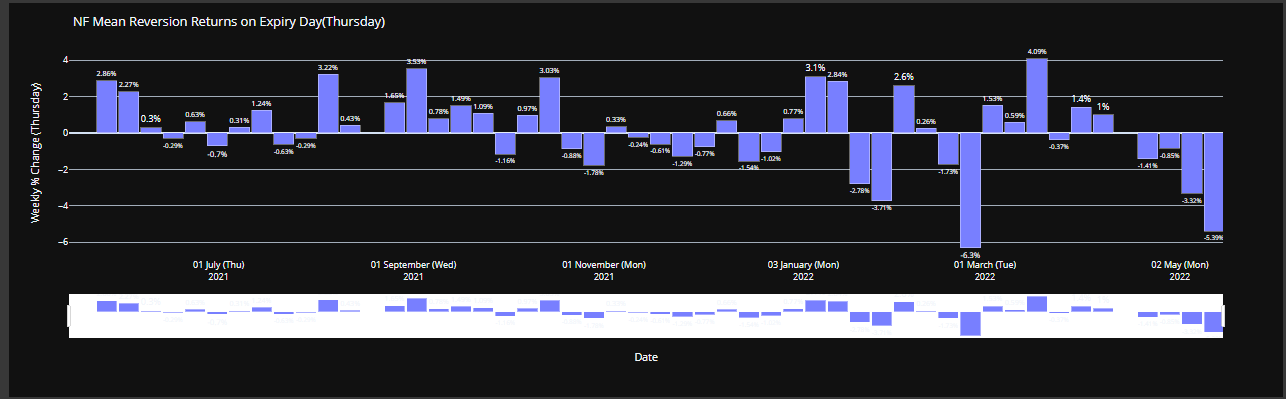
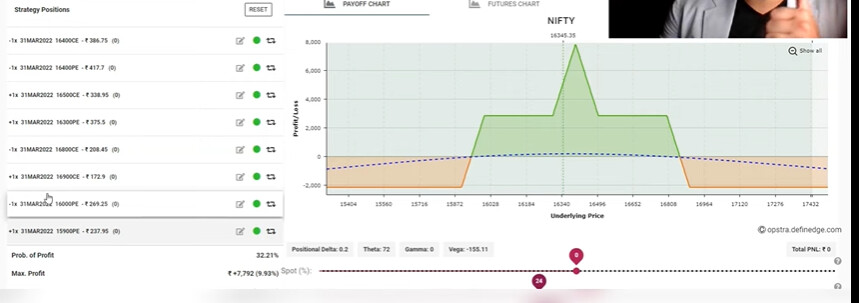
Resource-Stuck in Short Straddle and Short Strangle? Try this instead
Snap-
Thank You !!!