
Our goal with The Daily Brief is to simplify the biggest stories in the Indian markets and help you understand what they mean. We won’t just tell you what happened, but why and how too. We do this show in both formats: video and audio. This piece curates the stories that we talk about.
You can listen to the podcast on Spotify, Apple Podcasts, or wherever you get your podcasts and videos on YouTube. You can also watch The Daily Brief in Hindi.
We hosted our first-ever book club this weekend ![]()

In today’s edition of The Daily Brief:
- How’s the Indian economy doing?
- How well does the government spend
How’s the Indian economy doing?
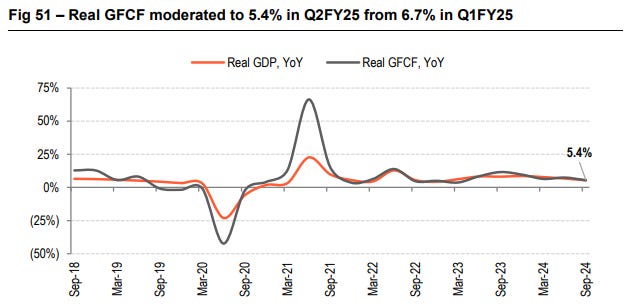
Last financial year, India was by-and-far one of the world’s growth bright-spots — in a world that seemed to be falling apart, we clocked a GDP growth rate of 8.2% for FY 2024. As we moved into this year, though, the story began to sour. In the first quarter, our year-on-year GDP growth slowed to 6.7%. In the second quarter, it had fallen dramatically – to just 5.4%.
So, the big question is: how do things look now ? Was that fall in growth just a blip? Or are we in for a prolonged economic malaise?
We’ve seen a few recent reports with very different numbers. Motilal Oswal believes the quarter was subdued, with growth at just 5.7%. SBI Research is a little more confident, penning in 6.2-6.3%. ICRA foresaw even more robust growth of 6.4%. Bank of Baroda was the most optimistic, seeing growth clock in at 6.6%.
Frankly, with so much variance, we’re not sure what to think. We’re just going to wait for the official numbers with an open mind. But then, GDP growth is just one number, and it hides as much as it reveals. A better thing to do, we thought, was to look under the hood — at how the overall economy was doing.
This is going to be messy. Don’t expect this story to give you a neat sense of what is happening. But the truth is that the economy is messy — GDP figures just over-simplify it.
One: How much overall economic activity do we see?
To begin with, let’s look at some broad-level indicators. These can give you a very rough sense of how the economy is doing, though you should be warned: these are extremely rough approximations of what’s happening.
Many entities mix together various different indicators, to come up with a generalized ‘index’ of how the economy is doing. We looked at some of these indexes, and here’s what we found. Over the last few months, while the economy wasn’t surging, it was pretty stable.
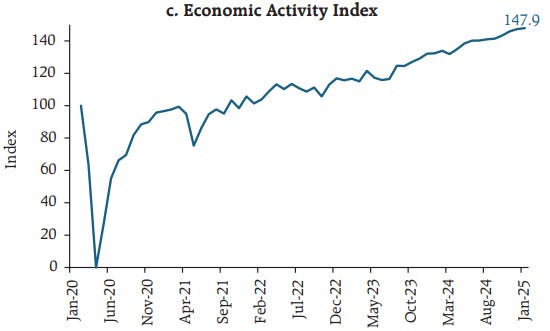
Source: RBI’s State of the Economy report
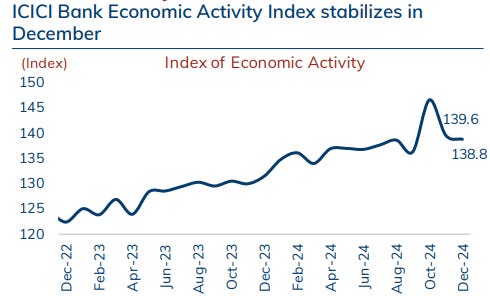
(Source: ICICI Monthly Chartbook
In fact, SBI Research actually thinks the economy has been accelerating over the last few months.
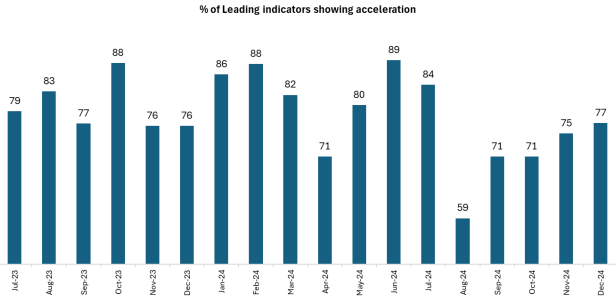
Source: SBI Research
But there are other ways to measure the economy. One of them is to just ask people how they’re doing. That’s what the RBI does — it conducts surveys to ask regular people how confident they are about their economic condition. Here’s what those surveys tell us: while consumers are optimistic about their future , they remain a little unhappy with how they’re currently faring:
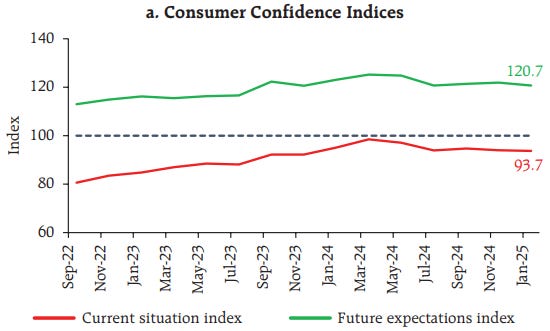
Source: RBI’s State of the Economy report
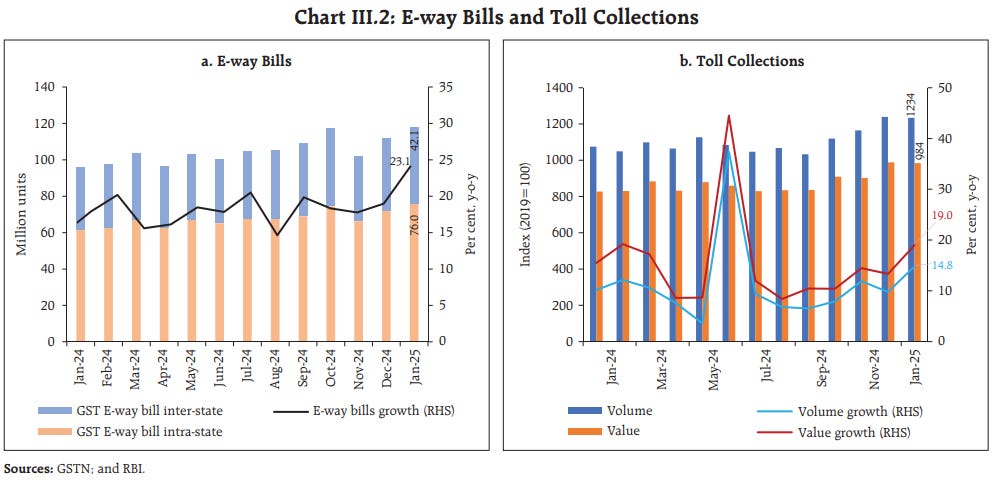
A good proxy for economic activity is how much people and goods are moving from place to place. There are a few key indicators that give us a sense of this. One is the E-way bills people prepare for GST purposes, whenever they’re moving large consignments around. The other is toll collections.
On both counts, January and December seem to have seen a rather strong flurry of movement. Before this, E-way bills had seen a noticeable dip in November — though there’s a decent chance that was simply a product of the post-Diwali lull. They’ve recovered since, though — posting more than 25% year-on-year growth in January.
Source: RBI’s State of the Economy report
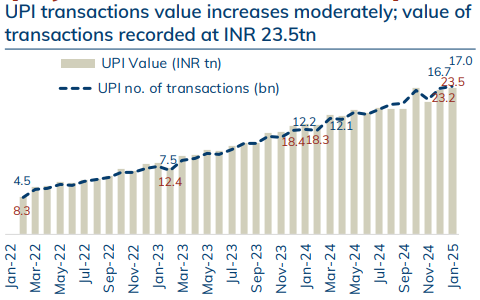
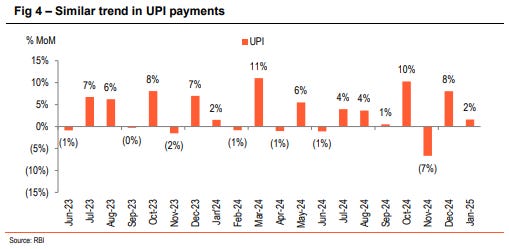
Another way of looking at the economy is to see how much people are paying each other. And interestingly enough, the same post-Diwali drop in activity turns up in payment activity. Consider UPI transactions, for instance:
Source: ICICI Monthly Chartbook
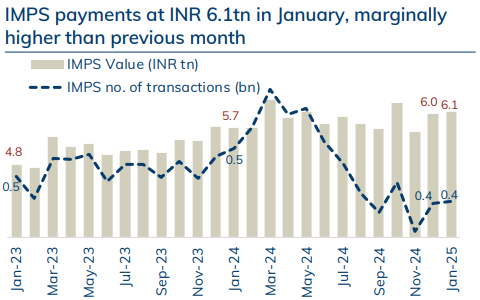
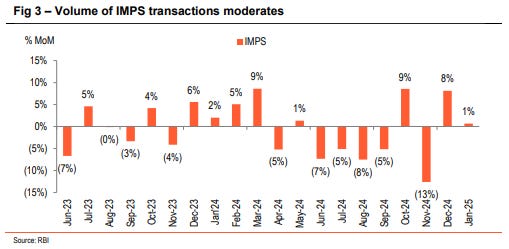
Or the data on IMPS payments:
Source: ICICI Monthly Chartbook
Year-on-year, both saw huge falls in November. Unlike E-way bills and tolls, however, in January, both saw muted growth.
Source: Bank of Baroda monthly chartbook
Source: Bank of Baroda monthly chartbook
Everything in an economy, ultimately, runs on energy. That makes power consumption another excellent proxy for the level of economic activity we’re seeing. And here’s what you see: In the second quarter of this year, power consumption had been absolutely dismal. Last quarter, though, it picked up — albeit not too sharply:
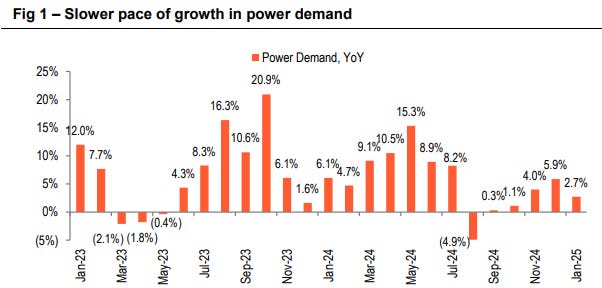
Source: Bank of Baroda monthly chartbook
You can also look at the amount of petrol India consumes, for the same reason. It gives you a very broad sense of how much people are moving around — which correlates loosely to the amount of economic activity in the country. Like power, petrol consumption had fallen, year-on-year, through much of the second quarter. It shot up after that, however — growing by 3.1%, year-on-year, in January.
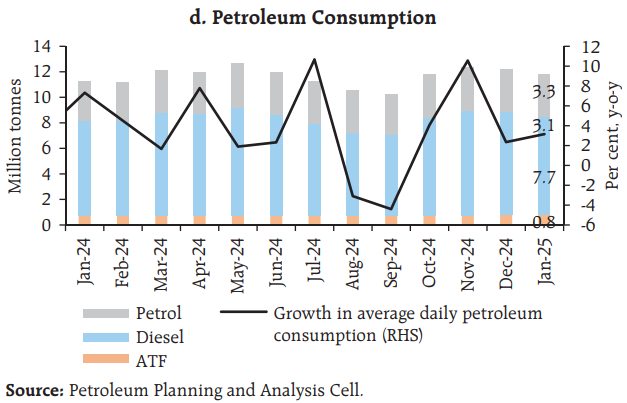
Source: RBI’s State of the Economy report
You see the same story play out with diesel consumption. Unlike petrol, which powers smaller vehicles, diesel is used for trucks and tractors — so it tells you about a different part of our economy.
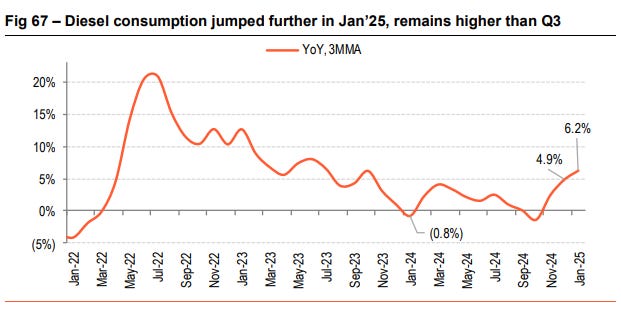
Source: Bank of Baroda monthly chartbook
Two: How well are regular Indians doing?
Ultimately, when you’re looking at economic data, you’re really trying to gain insights into the lives of regular people within that economy. So, here, we’re going to look at three ways in which the economy most often touches the lives of regular people like you and me: (a) how much are Indians consuming, (b) whether Indians have enough jobs, and (c) how much credit can Indians access.
Are Indians buying stuff?
An economy, ultimately, is an aggregate of millions of people who are all buying stuff. That’s why an important way of gauging the economy is to see how ready people are to make purchases.
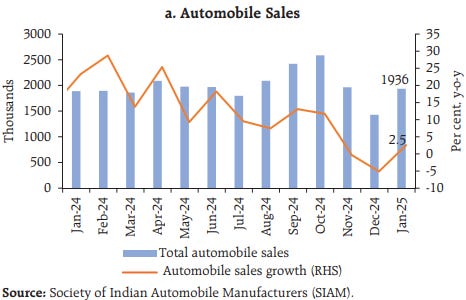
Perhaps the biggest purchase regular people make is a vehicle. And people only invest in vehicles when they feel confident about their future. This is why economists pay a lot of attention to automobile sales. Now, through most of last quarter, automobile sales declined. This could have been worrying. It would point to people turning pessimistic about their future. However, as we’ve noted before, in January, auto sales saw a major turnaround — possibly indicating that people’s confidence was returning.
Source: RBI’s State of the Economy report
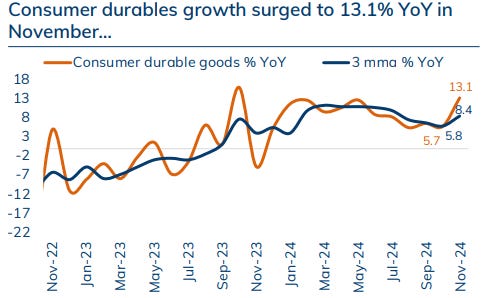
Other indicators of consumption, though, give one a rather complicated picture. The sale of consumer durables, for instance, saw a pronounced uptick over the last quarter.
Source: ICICI Monthly Chartbook
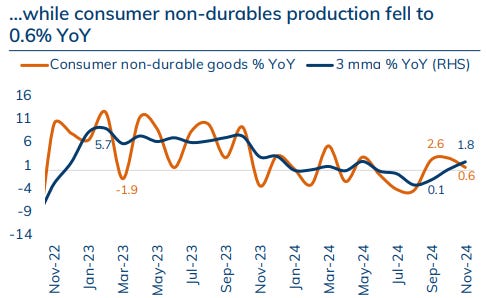
The growth in non-durables, on the other hand, remained rather flat. This closely mirrors what we saw when we were looking at the quarterly results of FMCG majors — most of which reported muted demand:
Source: ICICI Monthly Chartbook
Are Indians getting enough work?
Before people can make purchases, they need to earn money. One of the most important questions in an entire economy, perhaps, is how many jobs it’s creating.
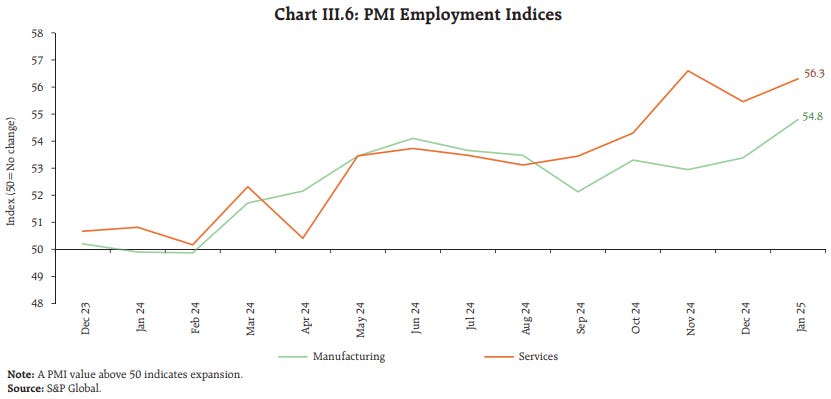
India’s organized sector has been busy creating jobs over the last few months. In both services and manufacturing, organized employment grew at one of the fastest rates we’ve seen since we began counting, back in December 2023.
Source: RBI’s State of the Economy report
Of course, most Indian jobs aren’t in the organized sector. A large portion of India’s economy is informal. Sadly, when you take the economy as a whole, India’s unemployment rate remains uncomfortably high — hovering around 8%.
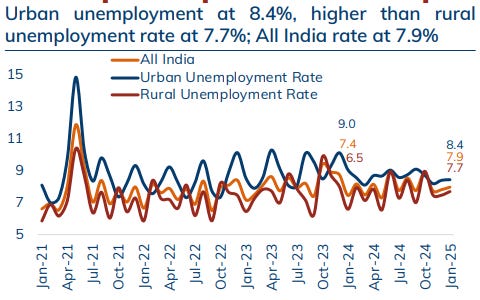
Source: ICICI Monthly Chartbook
Meanwhile, there’s a sharp difference between how many people work in urban and rural India. Employment in urban and rural areas diverged in January: while workforce participation went up in urban India, it fell in rural India.
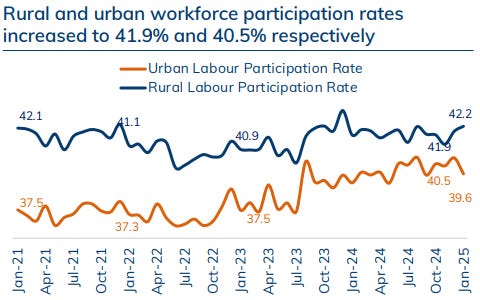
Source: ICICI Monthly Chartbook
Meanwhile, rural Indians turned to the government work guarantee schemes to get by. This showed up in a sharp uptick — of 14% year-on-year — in the number of people that turned to MNREGA, even though the actual availability of jobs went down.
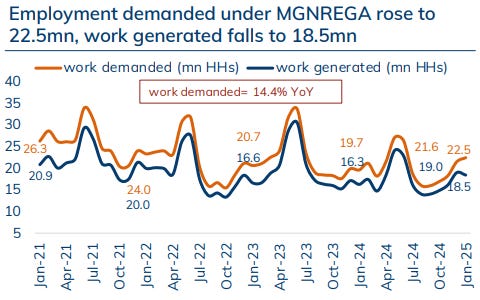
Source: ICICI Monthly Chartbook
Are Indians getting enough credit?
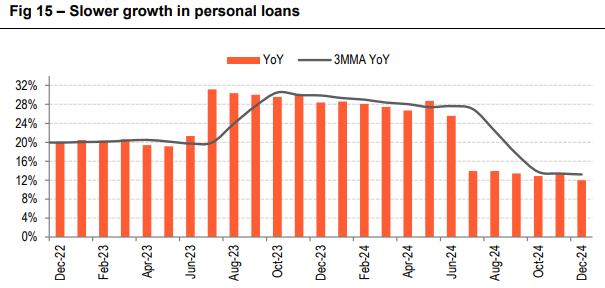
Not too long ago, the RBI was worried about the explosion in the growth of credit that regular people were taking. That even prompted RBI to increase the risk weights banks had to consider for retail lending. The data, however, shows that retail lending decelerated sharply after June last year, and has been relatively slow for more than half a year.
Source: Bank of Baroda monthly chartbook
You see the same trend play out for credit card bills — though the deceleration is a lot less dramatic.
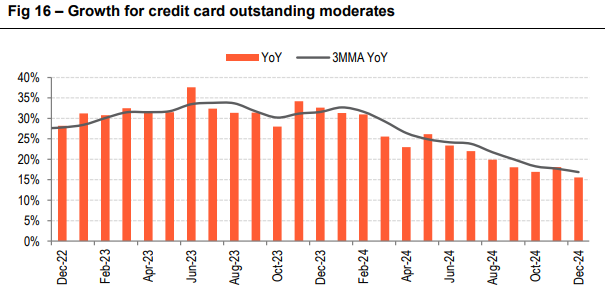
Source: Bank of Baroda monthly chartbook
Growth in the credit given for housing, too, fell off a cliff midway through last year.
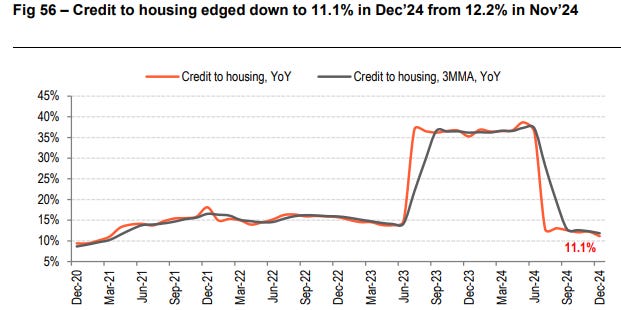
Source: Bank of Baroda monthly chartbook
Three: The Fate of the Rupee
If you’re plugged into economic news, you’ve definitely heard about the sharp fall the Rupee saw over the last few months. We’ve written about the Rupee’s fall in this newsletter too. Ultimately, the value of the Rupee depends on how much people want the Rupee — to buy things from India, and to invest in India — and conversely, how much Indians want foreign currencies. So, here, we’re going to keep things simple — looking at some important charts that can give you a sense of how much the Rupee is in demand.
In January, India’s merchandise exports contracted. This was largely because of a sharp decline in the export of petroleum products — perhaps after America slapped its latest sanctions on Russian oil. This off-set minor gains in a series of categories:
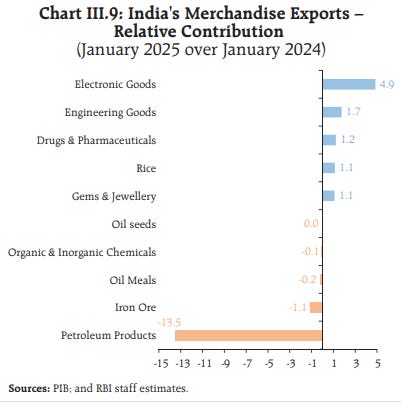
Source: RBI’s State of the Economy report
India’s merchandise imports, meanwhile, shot up sharply — by 10.3% year-on-year.
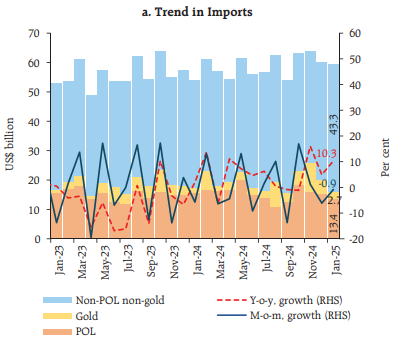
Source: RBI’s State of the Economy report
So, the demand for Indian goods went down, even as we demanded more foreign goods. Because of this, our merchandise trade deficit widened to $ 23 billion this January — from $16.6 billion in the same month a year ago.

Source: RBI’s State of the Economy report
This is part of a larger trend. Broadly speaking, our merchandise trade deficit has gone up considerably this financial year, compared to the last:
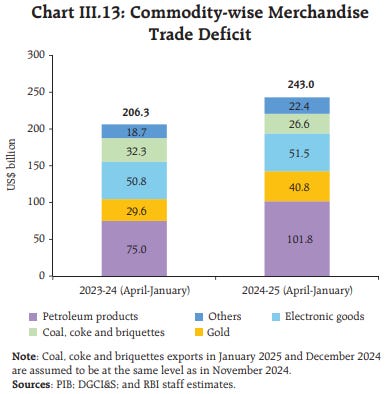
Source: RBI’s State of the Economy report
Services, however, invert this equation. This January, our services exports and imports both grew sharply — by 16.5% and 13.8% respectively, year-on-year. That said, our services exports are far more significant than our imports. In sum, therefore, we netted our best services surplus ever in January — of $ 19.1 billion.
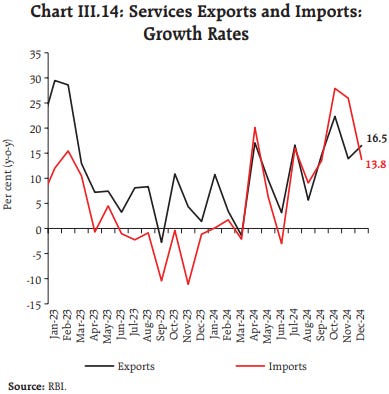
Source: RBI’s State of the Economy report
Things are less rosy when you look at investments into India — at what is called the ‘capital account’.
While India received more FDI this year than last, this was nullified by our outflows. The amount of money being repatriated from India, and the amount Indian companies invested abroad, both went up too. As a result, the net FDI into India was practically negligible.
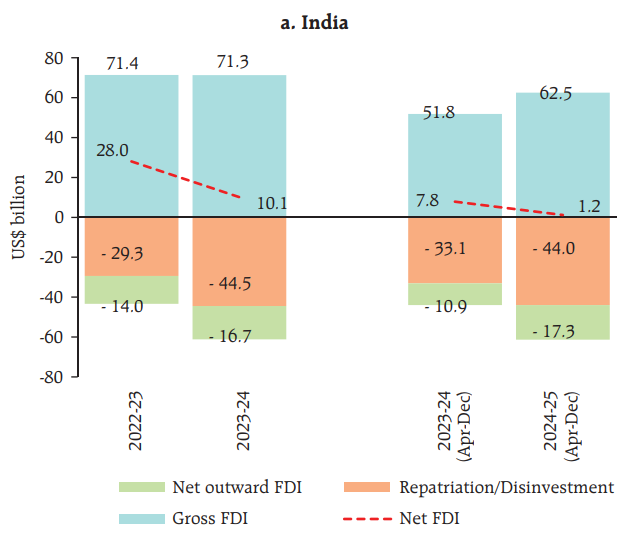
Source: RBI’s State of the Economy report
Things are worse when you look at Indian financial markets. As you probably know if you’ve been following the markets, portfolio investors have been withdrawing money at a rate we haven’t seen in years.

Source: RBI’s State of the Economy report
All of this has put the Rupee under serious downward pressure. The Rupee has now fallen to its lowest level ever. The RBI, too, has burnt through substantial sums of money in trying to defend the Rupee.
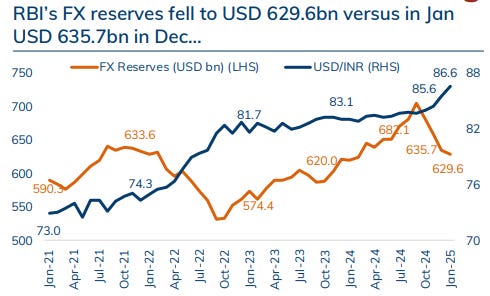
Source: ICICI Monthly Chartbook
Four: If India is growing, where is the growth coming from?
As we pointed out when we began this story, many analysts seem confident that the Indian economy is slated to improve its performance in the December quarter. The question is: if that’s true, where is the growth coming from?
They point to three things worth paying attention to: (a) improved capital expenditure, (b) an increase in manufacturing, and (c) a better-than-average season for Indian farmers. So, here, we’re going to dig into the data for all three.
The return of Capex
In the last few years, one of the biggest drivers of India’s growth was the government’s heavy emphasis on capital expenditure. That had dimmed earlier in this financial year, however, as the Lok Sabha was re-shuffled. But there are signs that it’s picking up once again. After a rather subdued October and November, the government ended the year with a bang — almost doubling its capex year-on-year.
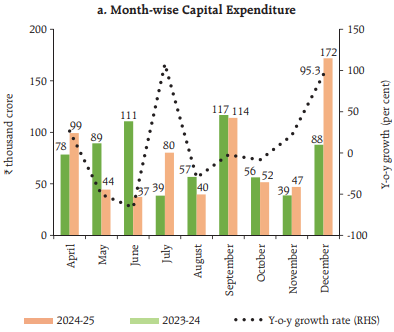
Source: RBI’s State of the Economy report
Overall, through the last quarter, the increase hasn’t been quite as dramatic. The central government’s capex nudged up by 1.7% year-on-year. State government capex, meanwhile, declined quite precipitously:
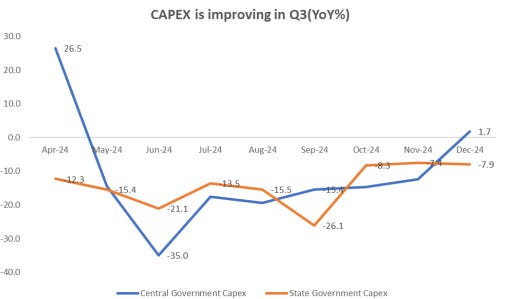
Source: SBI Research
A lot of the government’s attention, meanwhile, was on revenue spending — which went up at both the state and central levels.
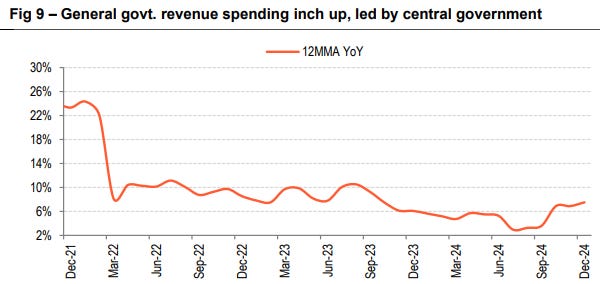
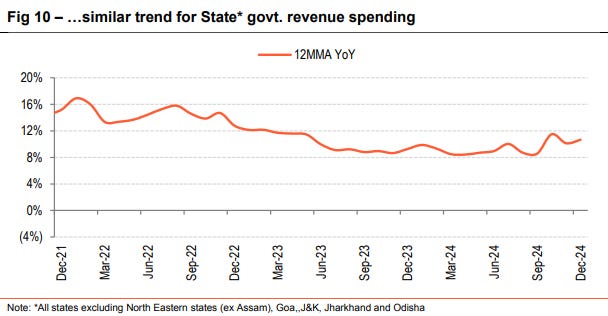
Source: Bank of Baroda monthly chartbook
Of course, the government is hardly the only entity that can take up capital expenses. In a healthy economy, private players take on most of that load. Sadly, that hasn’t been the case with India in a long while. Even now, private investment remains flat. Over the last quarter, there’s been no notable increase in the private companies’ intention to invest in the country.
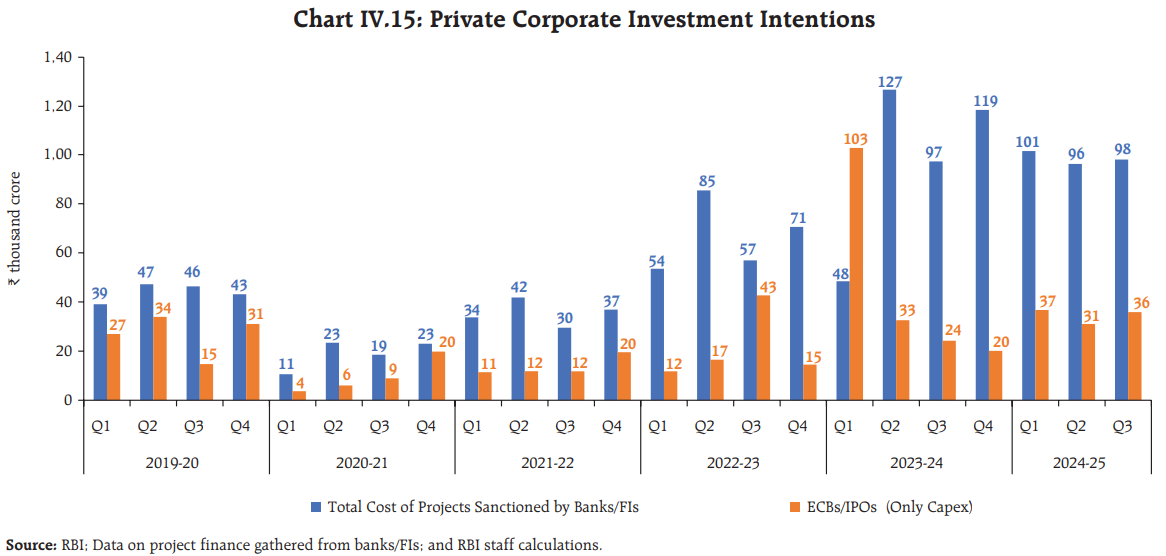
Source: RBI’s State of the Economy report
While we haven’t seen data for the December quarter, in the second quarter of this financial year at least, private investment actually grew slower than it did a year ago.
Source: Bank of Baroda monthly chartbook
But perhaps they were holding off because the overall economy had been flat earlier in the year. Through most of this financial year, corporate India saw its EBITDA figures drop year-on-year. Last quarter, though, that trend reversed. For the first time in the year, corporate EBITDA went up — by 5.2% year-on-year.
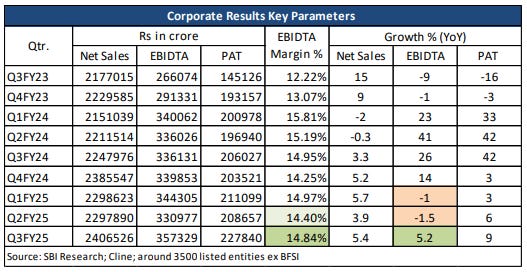
Source: SBI Research
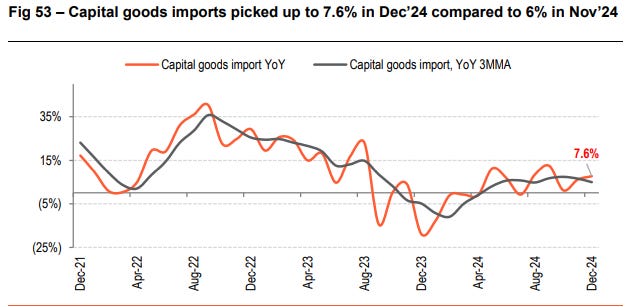
In a reassuring sign, after a brief dip, Indian companies have returned to importing more capital goods — with December seeing a year-on-year growth of 7.6%.
Source: Bank of Baroda monthly chartbook
More manufacturing?
There’s some evidence that the Indian industry has had a few good months on the trot. Industrial activity was trending upwards in the first two months of last quarter.
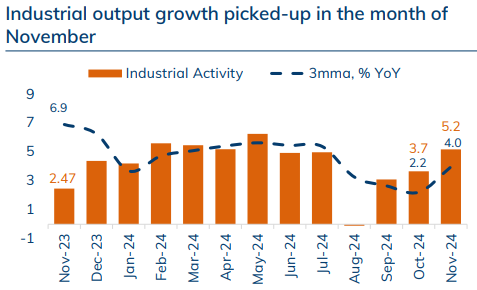
Source: ICICI Monthly Chartbook
Businesses, too, seem to be optimistic, with India’s manufacturing PMI trending upwards.
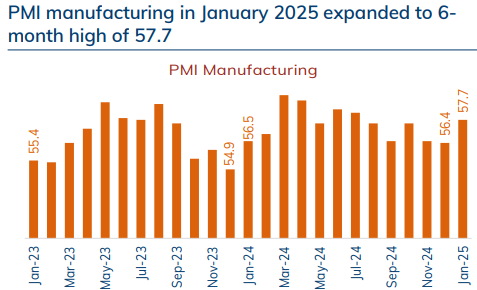
Source: ICICI Monthly Chartbook
India’s Index of Industrial Production has been growing again as well, after a dip in the second quarter of this financial year. In fact, in November, it had climbed to a six-month high year-on-year growth figure of ~5%, though it fell to 3.2% in December.
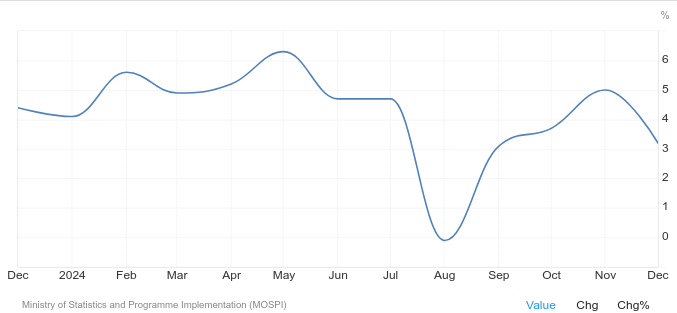
Source: Trading Economics
A better year for agriculture?
Last winter was a good season for Indian agriculture.
There was a mild increase in how much area was sowed with crops, this rabi season — at 1.7% year-on-year. Interestingly, though, fewer oilseeds and coarse cereals were sowed this year than the last.
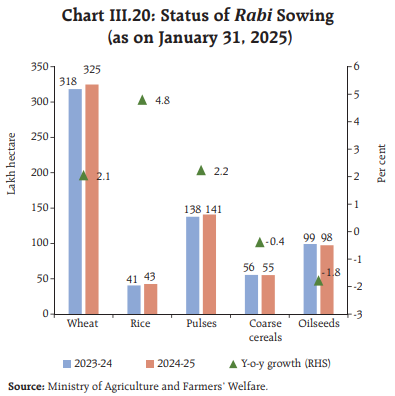
Source: RBI’s State of the Economy report
Fertiliser sales, on the other hand, shot up substantially — by over 10% year-on-year: The way we see it, while slightly more land was being cultivated, this cultivation was a lot more intensive.

Source: ICICI Monthly Chartbook
There’s some more good news. We saw better-than-average rainfall last year. And because of that, as we head into this summer, reservoirs across most of the country are better supplied than they were last year. That means there’ll be more water for irrigation when the next crop is sown.
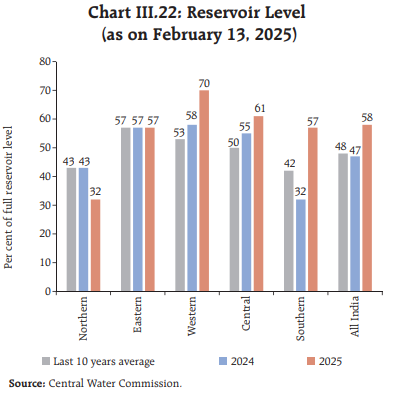
Source: RBI’s State of the Economy report
How’s the economy doing, after all?
If you’re looking for a single number — a GDP figure — to tell you how the economy is doing, you’ll probably get an official one soon enough.
At the end of the day, though, the economy isn’t a single number. It’s a chaotic, interwoven mess of moving parts — each telling its own version of reality. Growth rates fluctuate, credit cycles turn, trade balances shift and consumer confidence rises or falls. Some indicators suggest resilience, while others point to stress. I know that it can feel like a lot. But this is, for better or for worse, the state of the Indian economy.
How well does the government spend: A History
We’ve all heard of how the government should create development. But how should it really do that? The biggest answer is: public spending . But, of course, not all public spending is equal. Every rupee can build roads, power industries, educate children, and save lives — but it can also vanish through inefficiency and poorly designed schemes leading to no outcomes.
So, as important as it is for a government to spend , it’s also important that a government spends wisely. So, what is the quality of the Indian government’s spending? This is the subject of a recent Reserve Bank of India report.
Public spending can mean many things:
- Capital investment is usually the most visible part of public expenditure. When governments build highways, railways, ports, or power grids, they lay the foundation for economic activity. Businesses move goods faster, industries expand, and jobs emerge. Over time, that investment pays for itself by boosting an economy’s overall capacity.
- Then there are public goods — services like education, healthcare, clean water, and security. These essentials benefit everyone in society. They don’t directly generate profits, but they’re essential for society to grow.
- Then there’s development spending , which focuses on poverty reduction, agriculture, entrepreneurship, and skill-building. In theory, communities could handle some of these needs privately, but in practice, underserved populations often fall through the cracks. Government intervention is vital to uplift areas the market might otherwise overlook.
Governments need to be smart about how they divide their money between these buckets. They don’t have unlimited money to spend, after all. If they over-spend, they can end up running large deficits — and that creates chaos. It ruins the country’s savings, drives up interest rates, and hurts the economy’s future. Persistent debt also makes people (and more particularly, investors) less likely to trust a government, creating additional risks. (Gale and Orzag, 2003)
So, to gauge the quality of public expenditure, the RBI asks a few questions:
- Are we investing enough in infrastructure?
- How balanced is consumption, compared to asset creation?
- Are we prioritizing healthcare, education, and skill development?
- And how much of our budget is simply tied up in paying off old debts?
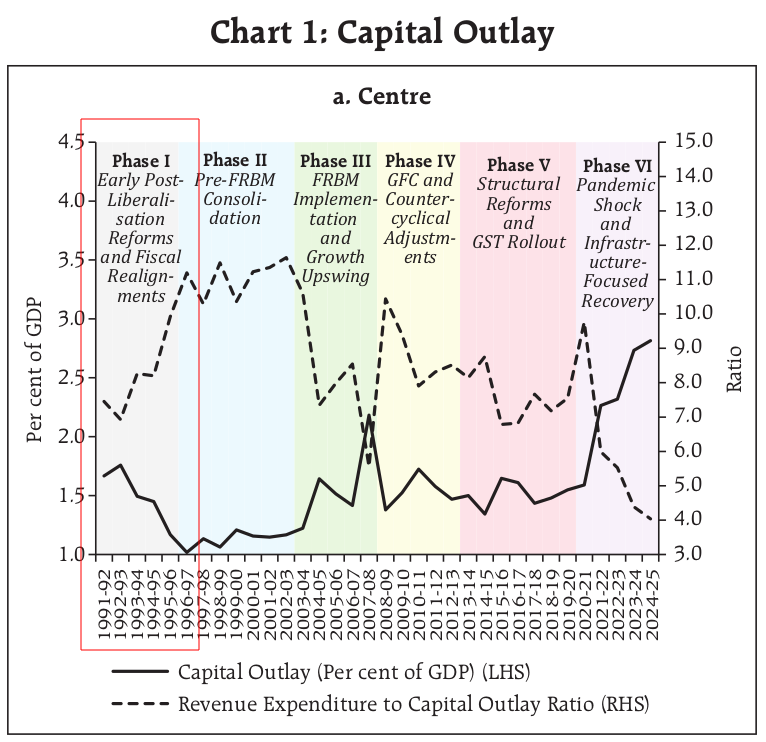
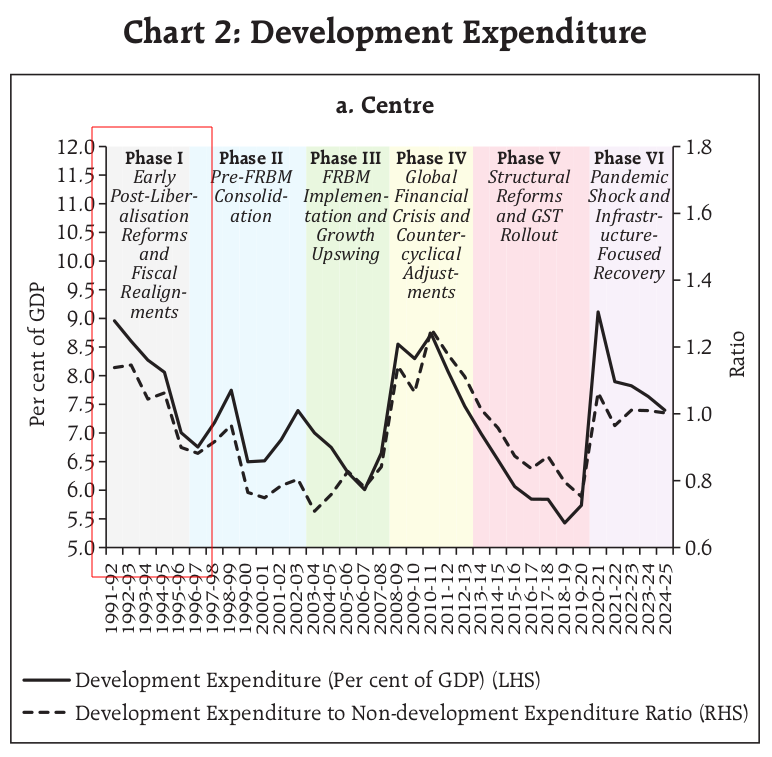
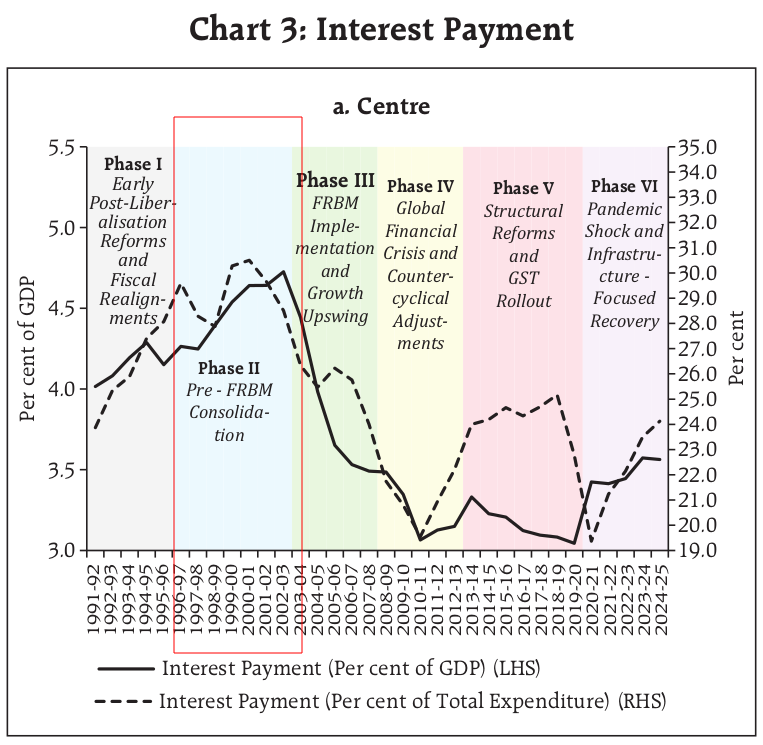
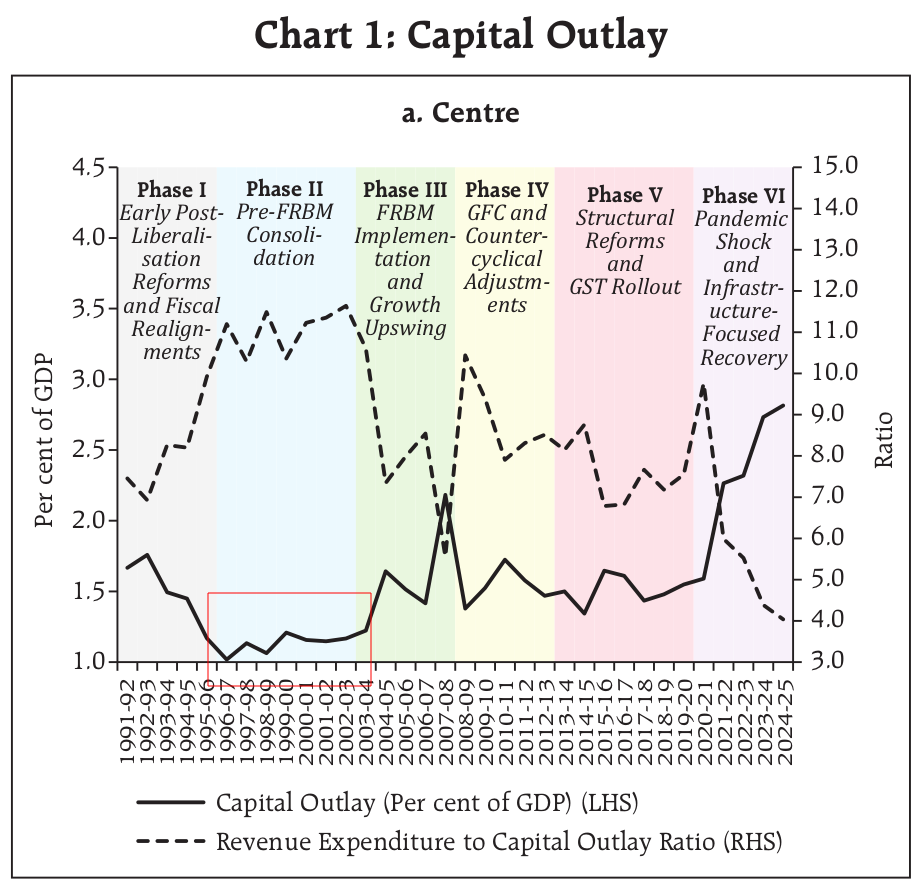
The RBI applied these metrics to judge India’s public spending in six phases — starting from 1991 to 2025. Its findings tell us about whether India is spending to build a better future, or if it’s simply mucking around. Let us talk about them one at a time.
Phase 1 (1991-1996): Post-Liberalization and Fiscal Realignment
The early 1990s were a turning point for India. We were trying to recover from a severe balance of payments crisis, and the government was taking up major structural reforms to liberalize the economy. Its entire focus was on maintaining stability as these reforms took hold. Capital investments had to take a backseat, as fiscal consolidation became the priority.
As our economy opened up, foreign investments started flowing in — giving us some breathing room. But we still had to be careful. Government spending had to be carefully managed to control inflation and maintain stability.
Source: RBI
However, the government couldn’t cut public expenditure too aggressively either. That would delay important infrastructure projects, and hurt social spending. Even so, this period saw a marked decline in development expenditure, as the focus remained on macroeconomic stabilization.
Phase 2 (1996-2003): Pre-FRBM Consolidation and Fiscal Stress
Towards the late 1990s, while India stabilized, a new challenge was emerging: rising fiscal deficits. The burden of interest payments grew, as our previous borrowing caught up with us. Government spending was therefore stretched — between supporting economic growth and managing debt.
The Fifth Pay Commission made things worse. It led to a sharp rise in government salaries, further straining the budget.
Because we were strapped for cash, during this period, capital outlays remained low. States found it difficult to fund infrastructure projects.
The effects of our lack of financial discipline were becoming evident — and it pushed policymakers to think of how India’s fiscal health could be improved. This led to discussions about introducing the Fiscal Responsibility and Budget Management (FRBM) Act, which would later play a major role in improving expenditure quality.
Phase 3 (2003-2008): FRBM Implementation and Economic Boom
Midway through the 2000s, we saw a golden period for public expenditure in India. The FRBM Act was put in place. Fiscal deficits were brought under control. We had a booming economy, which generated higher tax revenues — allowing increased investments in infrastructure. Roads, power plants, and urban projects saw a surge in funding.
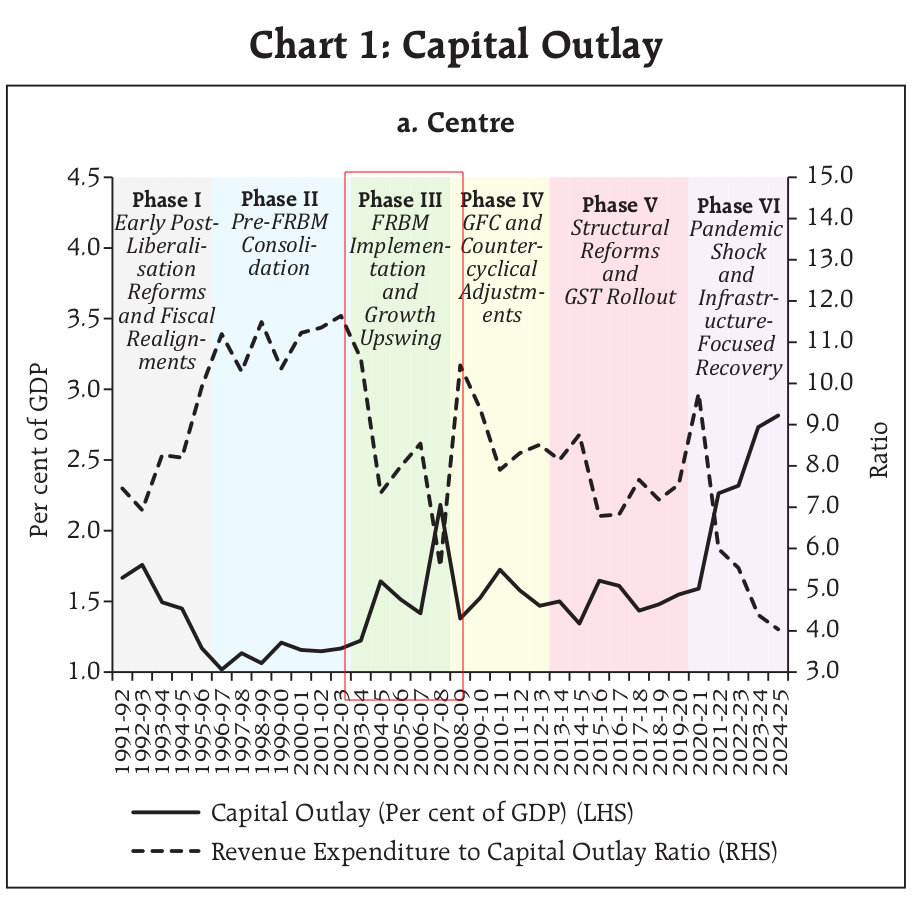
Our debt situation also improved over this time. Interest payments declined as a share of our expenditures, freeing up more resources for development. The revenue boost we got from economic growth allowed for important social sector projects. This gave us the space to introduce flagship schemes such as NREGA (National Rural Employment Guarantee Act) to enhance employment and rural development.
However, most of the growth in this era came from the private sector. Even as India grew more prosperous, inequalities persisted. Indian cities flourished — but rural infrastructure still lagged. So, while this was a period of high growth, its benefits were uneven.
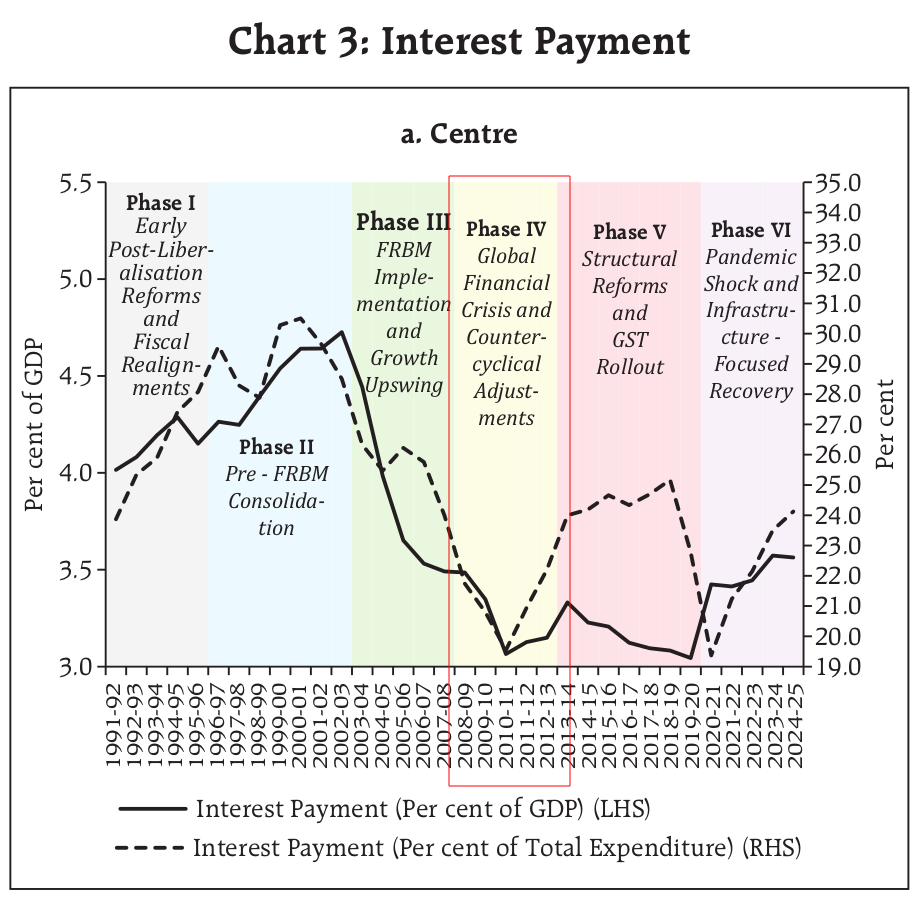
Phase 4 (2008-2013): Global Financial Crisis and Counter-Cyclical Spending
While India was riding high, suddenly, it was hit by an unavoidable challenge: the 2008 global financial crisis. This forced governments across the world to shift their spending priorities. India took counter-cyclical measures, spurring higher public spending to boost demand. The government introduced stimulus packages, cut taxes, and increased infrastructure investment to keep the economy afloat.
This was a double-sided coin. While this strategy prevented a recession, it also pushed fiscal deficits higher and increased our debt levels. Interest payments grew again, limiting the room we had for further productive spending. All the money that was added to our economy also created additional inflationary pressures. By the end of this phase, one thing was clear: fiscal consolidation was necessary to regain stability.
Phase 5 (2013-2020): Structural Reforms and GST Implementation
The next phase was a tricky one for India — with many major decisions that completely shook up Indian public spending.
For one, in 2013, India constituted the 14th Finance Commission. The commission suggested something radical — that a far larger chunk of central revenues had to be given to the states. With this, instead of 32%, states now had a right over 42% of central revenues. These recommendations were implemented in 2015, and they changed the fundamental makeup of India’s spending. States received more resources, allowing them to play a bigger role in economic planning and public expenditure. Armed with this extra revenue, they prioritized capital outlays and social spending.
Then, in 2017, India introduced the GST (Goods and Services Tax). This was a game-changer for public finances, streamlining taxation and improving revenue collection.
These reforms laid the foundation for stronger fiscal management. However, they also led to transitional disruptions. Some states struggled with revenue shortfalls in the initial GST years, affecting their ability to sustain development spending. The push for infrastructure continued, but funding constraints limited ambitious expansion.
Phase 6 (2020-2025): Pandemic Shock and Infrastructure-Led Recovery
The COVID-19 pandemic created an unexpected fiscal challenge. The pandemic required an immediate and capital-intensive response from the government. Massive public health spending, direct cash transfers, and emergency measures increased government borrowing significantly. Interest payments surged as debt levels grew. Deficits widened.
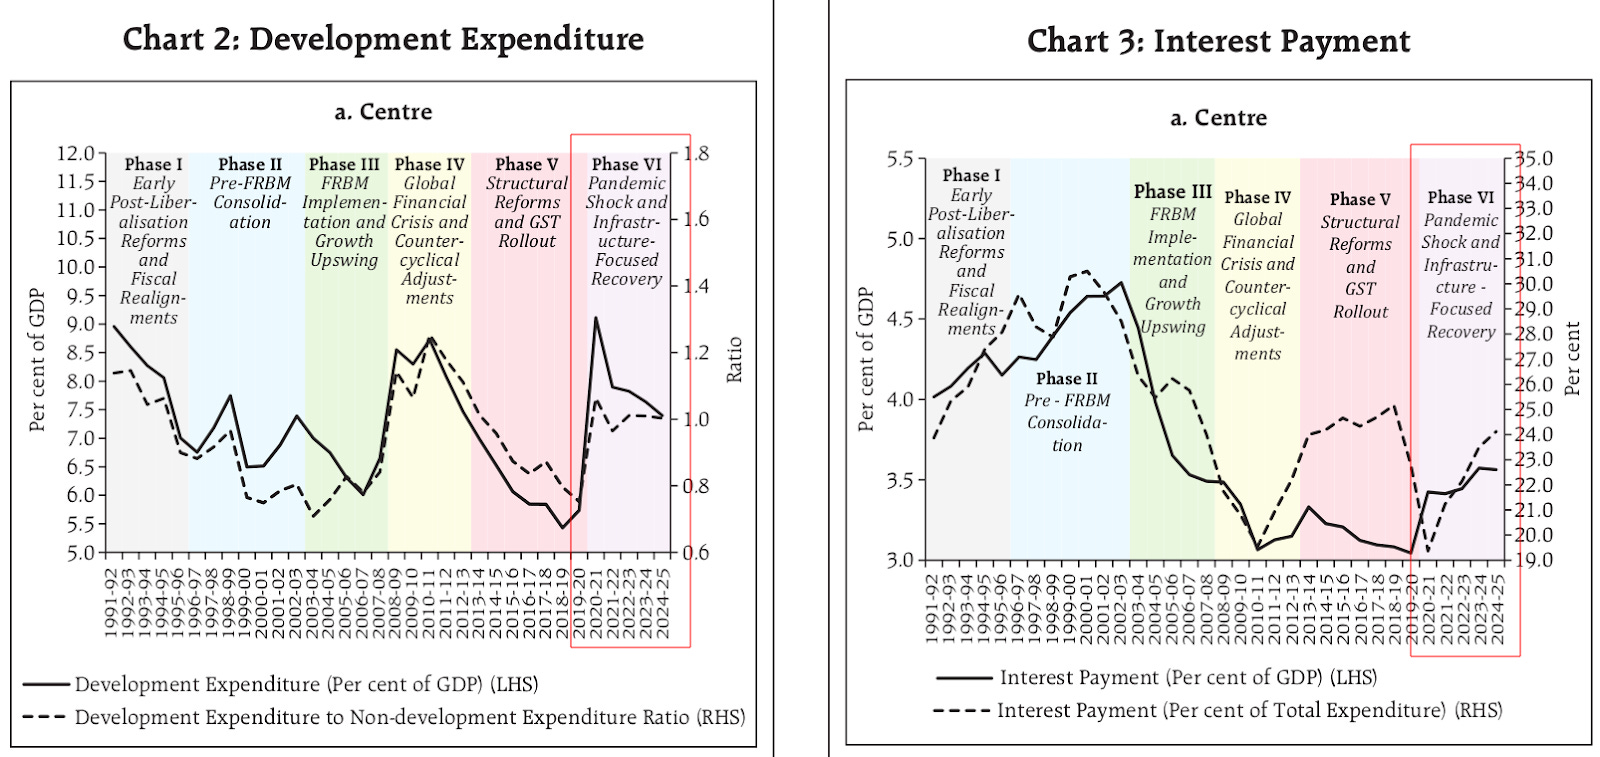
But as the country recovered from the pandemic, it made a strategic shift — towards infrastructure-led recovery. Demand had been subdued while unemployment was rising, and so, the government ramped up its capital expenditure to levels never seen before to revive economic activity. This was the period we saw the highest capital outlay since the study began, in 1991. This period also saw increased borrowing, but the expectation was that well-placed investments in roads, transport, and digital infrastructure would yield long-term gains.
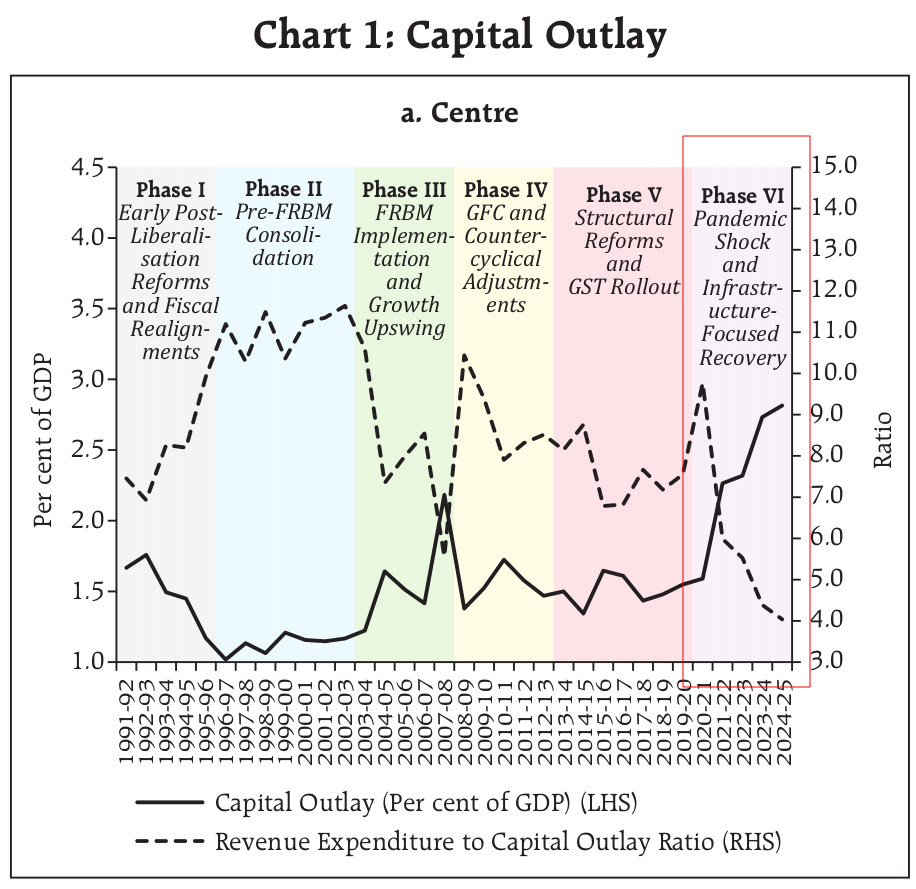
While this approach boosted economic recovery, the challenge remains — can India sustain high capital spending without creating unsustainable debt? We will see.
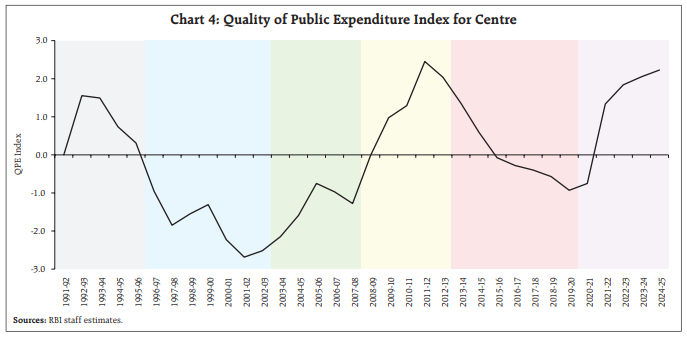
What does this teach us?
Putting all this together, here’s a quick glance at the quality of public spending by the centre over the years:
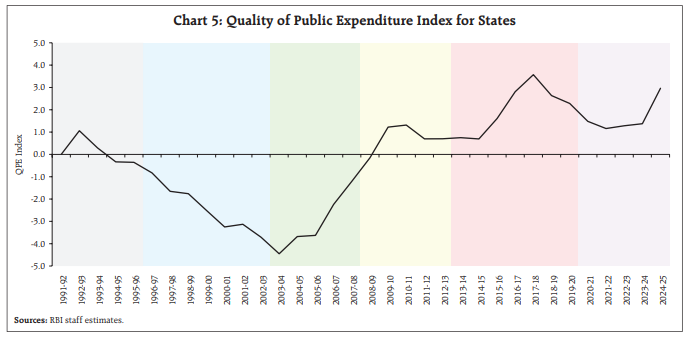
And here’s how Indian states have fared:
Throughout these phases, one lesson stands out: balance matters. Smart public spending means prioritizing long-term investments (infrastructure and human capital) over short-term fixes, while still maintaining fiscal discipline. Here are some lessons to learn:
- Focus on Productivity: Allocate resources where they generate sustainable returns—be it in roads, education, or skill development.
- Guard Against Excessive Borrowing : While borrowing more to fund development sounds attractive in the short term, high deficits can limit a government’s ability to fund development in the future, as more money goes toward debt servicing.
- Invest in People: Infrastructure alone isn’t enough; a skilled, healthy population is essential for inclusive growth.
- Maintain Fiscal Credibility: Investors and markets pay attention to how responsibly a government manages its balance sheet.
Moving forward, India’s challenge lies in ensuring that public spending decisions are strategic, growth-oriented, and fiscally responsible. After all, a government that invests wisely in both physical and human capital sets the stage for a resilient and inclusive economy—one where development is more than a buzzword and truly benefits the people it intends to serve.
Tidbits
- India’s external commercial borrowings or ECBs jumped nearly threefold to $15.6 billion in April-December 2024, driven by falling global interest rates. Gross ECB disbursements rose to $36.6 billion, up from $26.1 billion a year ago, while repayments stood at $21 billion. The share of effectively hedged ECBs increased to 78.1% from 61.6% in 2023, reducing forex risks. With the SOFR rate dropping by 85 bps since March 2024, the overall cost of ECBs declined by 25 bps, making foreign borrowing cheaper than domestic loans.
- The RBI’s Open Market Operation (OMO) auction saw bids worth ₹1.87 Lakh Cr., overshooting the notified ₹40,000 crore, underscoring the ongoing ₹1.77 Lakh Cr. liquidity deficit. In response, the RBI has purchased ₹1 Lakh Cr. in OMOs, including ₹58,875 crore via screen-based auctions and ₹39,000 crore in secondary markets. To ease the crunch, the central bank injected ₹1.33 Lakh Cr. through overnight Variable Rate Repo (VRR) auctions and plans another ₹75,000 crore via a 14-day VRR.
- Indian refiners have canceled 70,000 metric tons of crude palm oil (CPO) orders for March–June as Malaysian palm oil prices surged 11% in a month, pushing CPO costs to $1,210 per ton. In January, palm oil imports dropped 45% to 275,241 metric tons, the lowest in nearly 14 years, as refiners shifted to cheaper soy oil from Argentina and Brazil.
- This edition of the newsletter was written by Pranav and Kashish
 Have you checked out One Thing We Learned?
It’s a new side-project by our writing team, and even if we say so ourselves, it’s fascinating in a weird but wonderful way. Every day, we chase a random fascination of ours and write about it. That’s all. It’s chaotic, it’s unpolished - but it’s honest.
So far, we’ve written about everything from India’s state capacity to bathroom singing to protein, to Russian Gulags, to whether AI will kill us all. Check it out if you’re looking for a fascinating new rabbit hole to go down!
Subscribe to Aftermarket Report, a newsletter where we do a quick daily wrap-up of what happened in the markets—both in India and globally.
Thank you for reading. Do share this with your friends and make them as smart as you are ![]()