

Our goal with The Daily Brief is to simplify the biggest stories in the Indian markets and help you understand what they mean. We won’t just tell you what happened; we’ll tell you why and how too. We do this show in both formats: video and audio. This piece curates the stories that we talk about.
You can listen to the podcast on Spotify, Apple Podcasts, or wherever you get your podcasts and watch the videos on YouTube. You can also watch The Daily Brief in Hindi.
In today’s edition of The Daily Brief:
1. Is India’s finance boom outrunning its real economy?
According to a new report, a massive financialization boom—driven by an explosion in retail SIPs and household debt—is masking a stagnant real economy where industrial investment and real wage growth have both stalled out. With households taking on significant market risk and piling on unsecured personal loans just to sustain basic consumption, India must find a way to reignite actual industrial demand before this fragile, debt-fueled ecosystem faces a breaking point.
2. Can you put a score on a hospital?
NITI Aayog is reportedly developing a national quality framework to grade both public and private hospitals on actual clinical outcomes, readmissions, and patient safety. But while a public leaderboard would help patients make informed choices, it carries the severe risk of hospitals gaming the metrics—either by refusing to treat high-risk patients to protect their mortality scores or by altering their record-keeping to artificially inflate their success rates.
Our latest episode on Subtext is with serial entrepreneur and realfast co-founder Sidu Ponnappa. We speak to him about how AI is fundamentally reshaping organizations and what it actually takes to build a company at the foothills of the AI singularity.
It covers why treating AI agents like junior employees is a dangerous mistake, why the “$30-an-hour” middle tier of Indian IT workers is disappearing overnight, the real reason most enterprise AI pilots fail, and why India’s sovereign AI strategy shouldn’t be to beat the US or China, but to lock down the number three spot globally.
Watch the full episode here.
Is India’s finance boom outrunning its real economy?
India stands 146th in the world when ranked by per capita productive output. However, when ranked by stock market capitalization relative to GDP, we jump to 14th, which isn’t too far from the company of the US and the UK.
This chasm is the heart of a report on India’s macroeconomy by the Azim Premji University’s Centre for the Study of the Indian Economy.
Written by Puneet Bhasin and Anshuman Singh, the analysis agrees on the well-known facts about India’s headline numbers. Real GDP growth has hovered around 7-8%, inflation is subdued, corporate balance sheets are the cleanest they have been in a decade, and the banking system has more capital than it knows what to do with.
But the report pulls at the seams of these findings and finds three structural vulnerabilities that the headline numbers are papering over.
The report is divided into three sections, each of which provide a lens into the Indian economy that eventually combines a cohesive picture. We recommend reading the report in its entirety, but if you’re strapped for time, we try to make a succinct attempt at understanding it all as a whole.
(Note: earlier, we covered another report by the same institution on Indian unemployment. We recommend watching our Subtext episode with the authors of that episode, Rosa Abraham and Tamoghna Halder.)
Leverage and baggage
The first section of the macro-economy report is about India’s lack of capex (which we covered sometime last year), and what it says about demand.
To understand that, a little history is instructive.
In the mid-2010s, India went through a twin balance sheet crisis, where companies that had over-borrowed primarily for power and infrastructure projects began to go bust. Those that barely survived had loads of leverage that they now had to clear.
So, companies began cleaning their books aggressively. The share of firms whose operating earnings couldn’t cover their debt service payments fell from a peak of ~19% in 2016 to ~10.5% in 2025. Net bad loans at commercial banks hit historic lows.
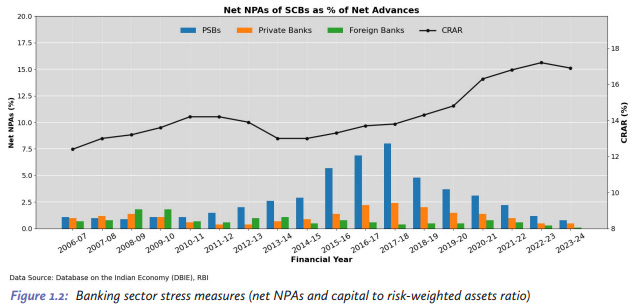
Eventually, balance sheets became clean, banks ended up with surplus capital, and borrowing costs for large industrial firms began trending down. By any textbook, this is the perfect launchpad for the next private investment boom.
But the authors make a key distinction in how corporate India moved out of the crisis. It didn’t grow its way out, but shrank. The financial footprint of India’s non-financial corporations in FY2023-24 is substantially smaller than it was a decade earlier. Companies shed debt, yes, but only by shedding assets. They did not invest in new capacity.
This is not necessarily a bad thing. But the hangover of this crisis, the authors say, explains the stubborn investment gap we see in India today.
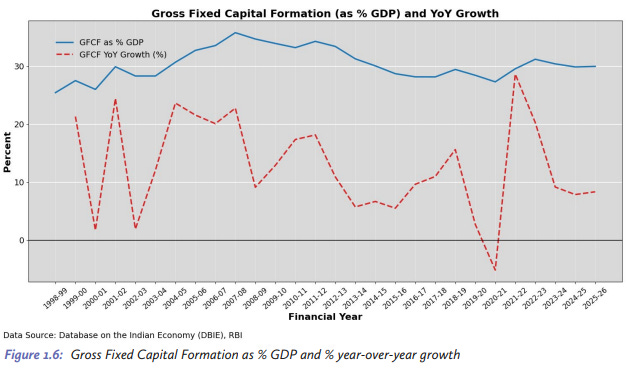
India’s gross fixed capital formation (GFCF) has held steady post-pandemic at an average of around 30% of GDP. Compare that to the acceleration India saw in the mid-2000s, when it peaked at 35.8%. Net borrowing by corporations, which is a rough proxy for fixed investment spending, averaged ~6% of GDP before the crisis, but hovers near 4% now.
What is holding firms back? Well, a few weeks ago on Subtext, we called investment manager Arvind Chari to talk about the Indian macroeconomy, and his answer was the same as that of this report: demand. Businesses will only build new factories when they expect customers to show up. Right now, all engines of aggregate demand are muted.
Start with consumers. Real wage growth has remained stagnant for years. Household consumption looks resilient in the aggregate, but much of it is being propped up by debt rather than rising incomes. We’ll return to this pattern shortly.
Another potential engine is exports. India’s exports have averaged 21.8% of GDP since CoVID. That’s lower than the 24.4% average between 2010-2014, when the world was recovering from the global financial crisis.
Lastly, there’s the government. The one component of demand most directly under policy control has also been pulling back. The central government’s primary deficit crashed from 5.7% of GDP in FY21 to 0.8% in FY26. This consolidation came almost entirely from cutting revenue expenditure on wages, subsidies, and grants. Capital outlay has also only risen modestly, and not enough to compensate for the broader withdrawal.
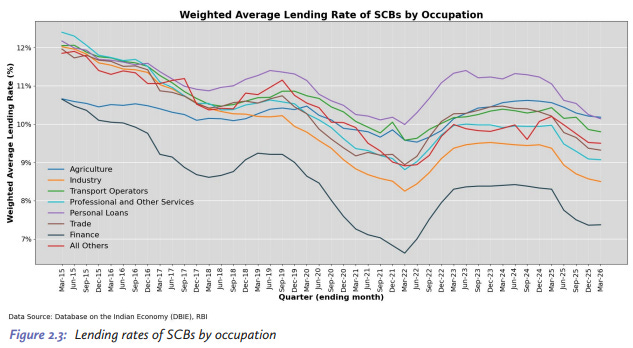
The banking data confirms what the macro data suggests. Credit depth in the industrial sector has been declining consistently. Lending rates to industry are the second lowest of any sector, and they are still trending downward. But banks are not refusing to lend; rather, on aggregate, industry hasn’t been asking.
A stock market without a factory floor?
If industrial firms are sitting on their cash and the central government is tightening its belt, where is the nation’s surplus capital actually going? It is entering straight into the financial markets.
In the view of the authors, in India, financial activity is overshadowing industrial production as a source of income and wealth. This is called financialization, and it’s typically something that happens after an economy has industrialised. The US, for instance, built its deep capital markets after it built its manufacturing bases.
So financialization itself isn’t really a bad thing. But the sequence is important, and India seems to be doing it in reverse. We are rapidly expanding financial markets while manufacturing, productive investment, and broad-based employment creation remain weak.
On that note, there are three shifts happening all at once and interconnected.
The first is a transformation in how Indian households save. For decades, the default for any family with spare cash was a bank fixed deposit. But now, households more than doubled the share of investment fund units in their asset portfolios between FY16 and FY24. Bank deposits, meanwhile, dropped five percentage points to 46.8%. The shift is not wholly a metro phenomenon, either. SIP registrations grew 3.1 times in smaller cities between 2020-2025, compared with 2.3 times in bigger cities.
Now, the mutual funds who held these SIPs, insurance funds and pension funds invested a lot of their money in government securities. In fact, by FY24, these non-bank financial corporations held ~41% of general government debt, while commercial banks held ~37%. But this wasn’t always the case. This is the second shift driving India’s financialization: who finances the Indian government?
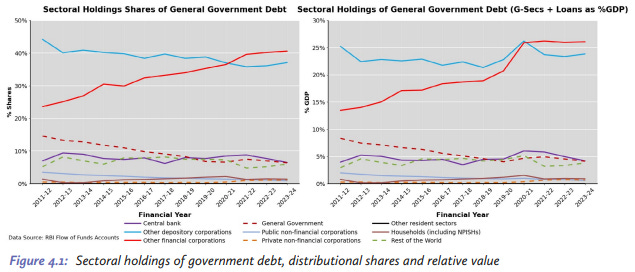
Before liberalisation, it was mostly public banks who bought government debt, primarily because a high statutory liquidity ratio (SLR) forced them to absorb government securities. But the SLR has since been lowered, and with it, came a change in the model. So now, through fixed-income products like mutual funds and pension funds, household savings constitute an important intermediation link for financing the fiscal deficit.
The third shift is what the first two made possible. India’s equity markets, for the longest time, were very sensitive to what foreign portfolio investors (FPIs) did. When FPIs sold, markets fell as a whole, and when they bought, markets rallied hard.
But now, that dynamic has fundamentally weakened because domestic institutional investors (DIIs) stepped in. Markets more than survived through foreign selling. This is a genuine resilience gain. In a world of rising geopolitical volatility and capital flow reversals, having a domestic savings base that can absorb foreign selling is an edge.
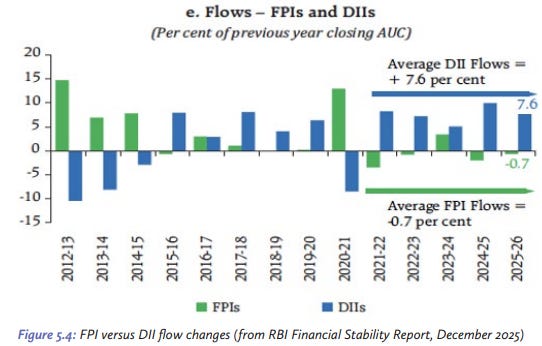
But the report argues it also creates a new, different kind of fragility.
When government debt sat quietly on the books of commercial banks all the way until their maturity, paper losses from bond price fluctuations could be managed without panic. But now that a growing share of government bonds sits in mutual funds which have daily redemption windows, a sharp spike in government bond yields triggers immediate mark-to-market losses. Those losses can feed into redemption pressures. And redemptions from mutual funds, unlike bank deposits, have no lock-in period.
Credit is replacing income
Meanwhile, the household balance sheet itself is financialising on both sides at once. On the asset side, savings are shifting from deposits into market-linked instruments. But on the liability side, borrowing is accelerating, and not because households are flush with confidence.
Household sector liabilities rose from 34% of GDP in FY19 to 41% in FY24. The pace of new borrowing is accelerating faster than even the stock suggests: annual loan flows jumped from below 4.5% of GDP before FY23 to 6.2% in FY24. Total quarterly personal credit depth climbed from 13.5% of GDP to 18.4% over the same period.
Some of this could mean that millions now have access to formal credit channels that were previously unavailable to them. However, since real wage growth has been weak, the more likely reading is people are borrowing more because their incomes haven’t grown meaningfully.
This is best visible in the three categories driving loan book growth the most.
One is housing loans. Two is a massive expansion in unsecured personal credit: think buy-now-pay-later schemes, app-based top-ups and consumer durable loans. Lastly, there’s loans against gold jewellery, which have likely surged because rising gold prices enable households to take on fresh borrowing against the same physical stock of ornaments.
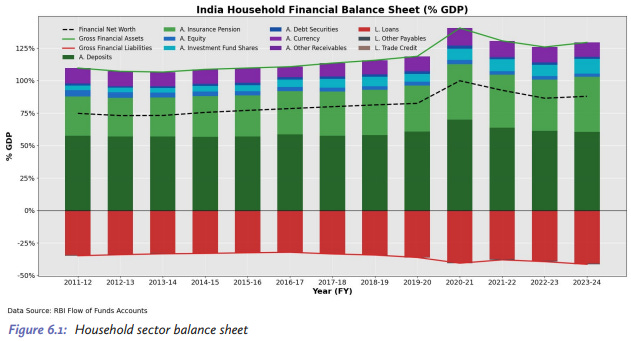
The picture that emerges is unsettling in its symmetry. On the asset side of their balance sheet, Indian households are taking on more market risk by shifting savings from deposits to equities. On the liability side, they are taking on more and more debt, that too as a substitute and not a complement to income. Household net financial wealth is rising in the aggregate, but so is leverage. If a market correction or an income shock hits, the two sides can feed on each other.
The thin external cushions
Now, what about India’s external position with the rest of the world?
On net, India runs a trade deficit. This is driven by a few things, like the import of crude oil and that of manufactured goods like electronics and machinery. In fact, electronics goods alone climbed from ~10% to 17% of the top-10 imports basket between 2015-2025.
So, India’s goods trade deficit is both about commodity dependence and a manufacturing base that’s yet to be fully developed. But only one of them is in our hands. We can’t create these commodities out of thin air. We will have to build an ecosystem that exports manufactured goods at scale.
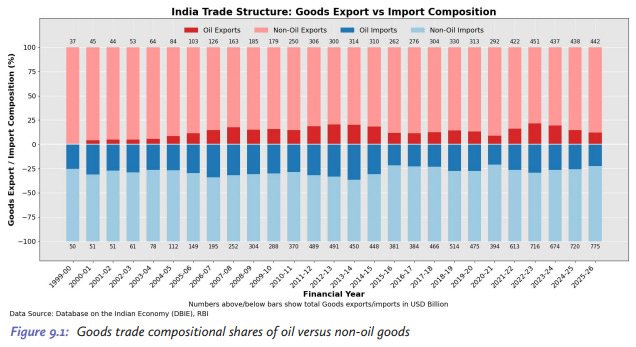
Naturally, China is the dominant source for India’s goods imports making up $113.5 billion, or ~16% of total goods imports in FY25.
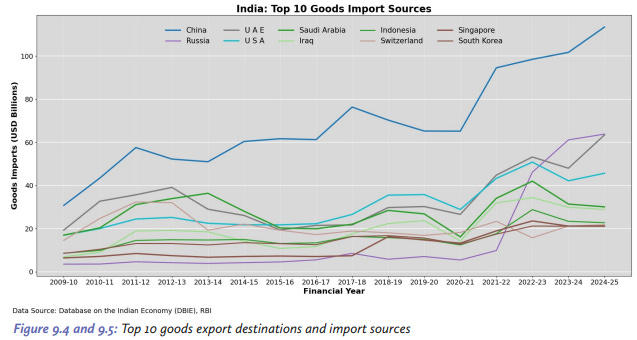
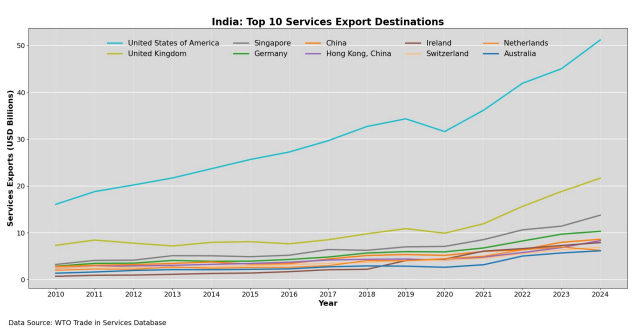
The US, meanwhile, is the largest destination for India’s goods exports. In services too, the US is the single largest partner by a wide margin. Services exports continue to offset much of the goods deficit.
Interestingly, what anchors the external position is not FDI or portfolio flows (which have been declining), but remittances. At $138 billion in 2024, India receives the highest remittances in the world by a wide margin. Since mid-2013, remittances have on average covered more than 100% of India’s trade deficit.
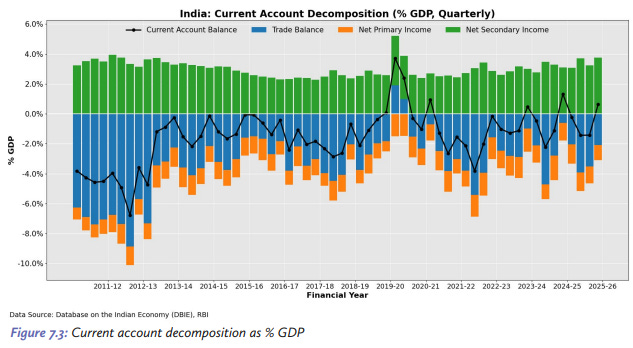
Unlike portfolio capital, remittances are transfers, not claims. They do not reverse during market selloffs episodes, they do not generate future liability outflows, and they provide a stable stream of foreign exchange that cushions the rupee. Yet they are routinely overlooked in market commentary.
Of course, given that the world is increasingly on the edge, trade openness itself has declined. India is less integrated with the global economy today than it was a decade or so ago. Now, its growth remains domestic-demand driven. But if that domestic demand is being held up by household borrowing rather than rising incomes, the foundations are more fragile than they appear.
Conclusion
None of this amounts to an imminent crisis. But the report makes a pointed argument about what comes next.
The conditions for the central government to spend more are better now than they have been in years. Fiscal consolidation is largely done. Government borrowing costs are falling as the RBI eases into a new rate-cutting cycle.
The demand gap is not a theoretical concern anymore. It is putting brakes on private investment, it is visible in credit data, industrial production indices, and corporate borrowing patterns alike.
India has to figure out how to use the policy room that it has created before household leverage reaches a boiling point, and narrow the bridge between our financialization and productive capacity.

Can you put a score on a hospital?
We’ve written about hospitals in The Daily Brief several times. If you wanted to understand whether Apollo, Fortis, Max or Narayana was running a good business, we had numbers for you: bed occupancy, revenue per occupied bed, operating margins and expansion plans.
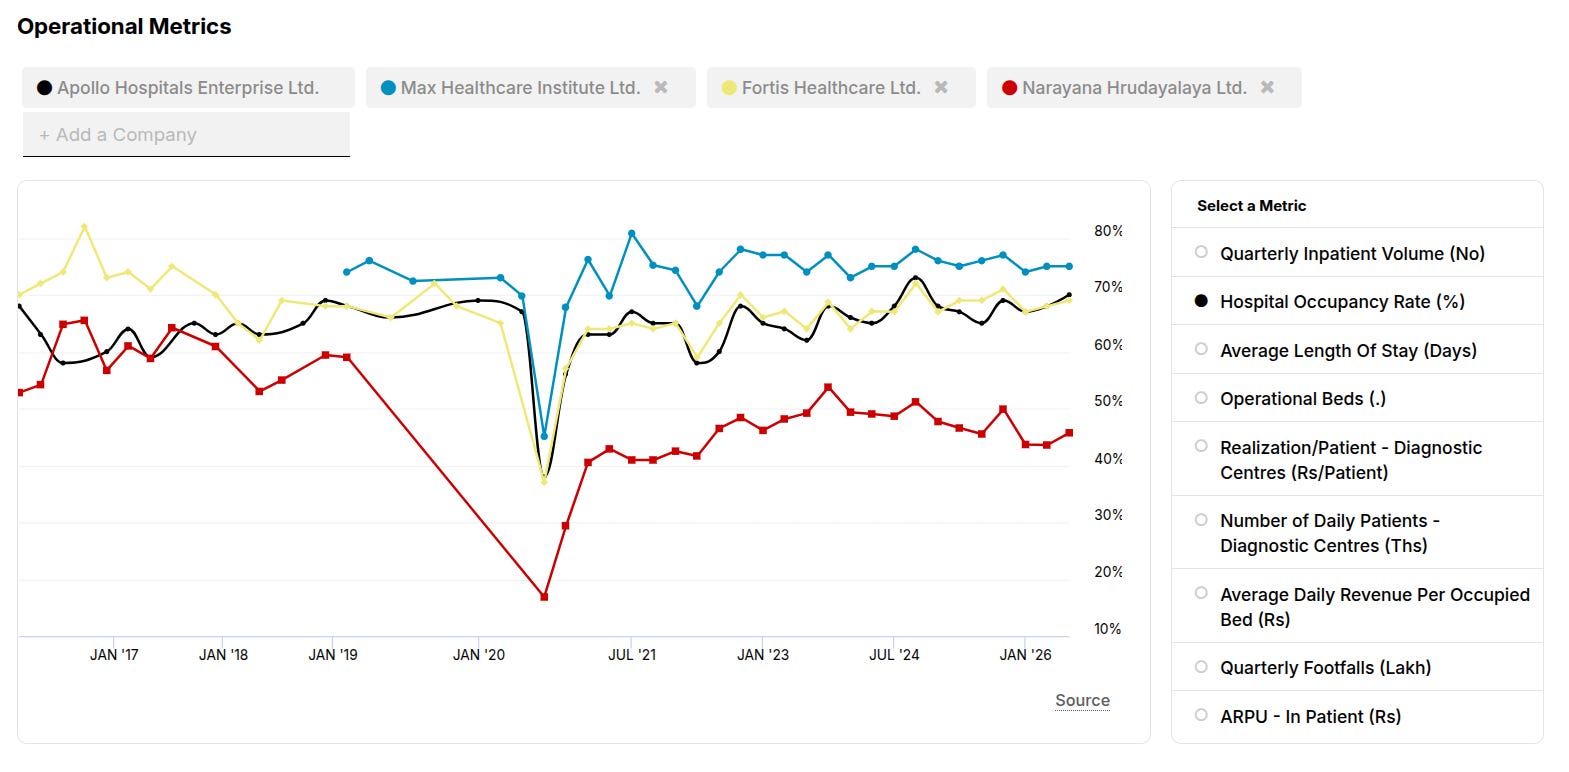
Comparing hospital’s operational metrics on Tijori Finance
Useful numbers, if you’re buying the stock.
But suppose you’re choosing a hospital for heart surgery.
Now you’d want a completely different set of numbers. How often do patients walk out with complications? How many have to come back shortly after being discharged? What’s the actual survival rate for the procedure you’re about to have?
Those numbers are much harder to find in India.
That might start to change. NITI Aayog is reportedly working on a national quality framework that could grade both public and private hospitals on things like clinical outcomes, readmissions, medication errors, patient safety, patient experience and procedure-specific survival rates.
The appeal is obvious. Patients deserve better information before making consequential decisions. But making that information trustworthy is harder than assigning a grade.
Don’t we already rate hospitals?
Sort of.
Two prominent systems already assess hospital quality. The first is NABH, the National Accreditation Board for Hospitals and Healthcare Providers. It’s an independent body that checks whether a hospital has the right systems in place, things like infection control, medication management, patient rights and clinical protocols.
Hospitals apply voluntarily and have to maintain compliance to stay accredited. NABH says more than 29,000 healthcare facilities are accredited or certified across its programmes, though that figure includes labs and clinics, not just full-service hospitals.
The government also runs the National Quality Assurance Standards, or NQAS, for public facilities. By December 2025, 50,373 facilities were certified, overwhelmingly primary-care centres; 1,710 were secondary-care facilities.
These systems do more than just check paperwork. NQAS explicitly includes outcome indicators, while NABH’s standards also address outcomes, clinical audits and patient experience.
But checking whether a hospital meets quality standards is different from showing patients how it compares with other hospitals treating similar people. An accreditation badge alone cannot tell you that. A useful public rating would need to make those comparisons possible.
The patient matters as much as the hospital
Imagine two hospitals performing the same operation on a thousand patients each. Twenty patients die at Hospital A; forty at Hospital B.
Hospital A looks better. Except Hospital B is a referral centre treating older, sicker patients whom other hospitals cannot manage.
The death rates tell us what happened. On their own, they don’t tell us which hospital provided better care.
That requires risk adjustment: accounting for patients’ health before treatment and comparing their outcomes with what we’d expect for similar patients. Even then, a statistical model cannot account for every difference.
Small numbers pose another problem. A hospital with no deaths in ten operations hasn’t necessarily performed better than one with a low death rate across thousands. The US withholds some hospital comparisons when there are too few cases to judge reliably.
Deaths are also only one part of the picture. We need to look at readmissions, how often patients return shortly after discharge, as well as hospital-acquired infections, medication errors and complications after surgery. Patients’ experience matters too. So does their recovery: did a knee replacement actually help them move better?
The United States has been attempting this for years. Its Medicare Overall Hospital Quality Star Rating combines about 52 measures across five groups covering mortality, safety, readmissions, patient experience and timely care.
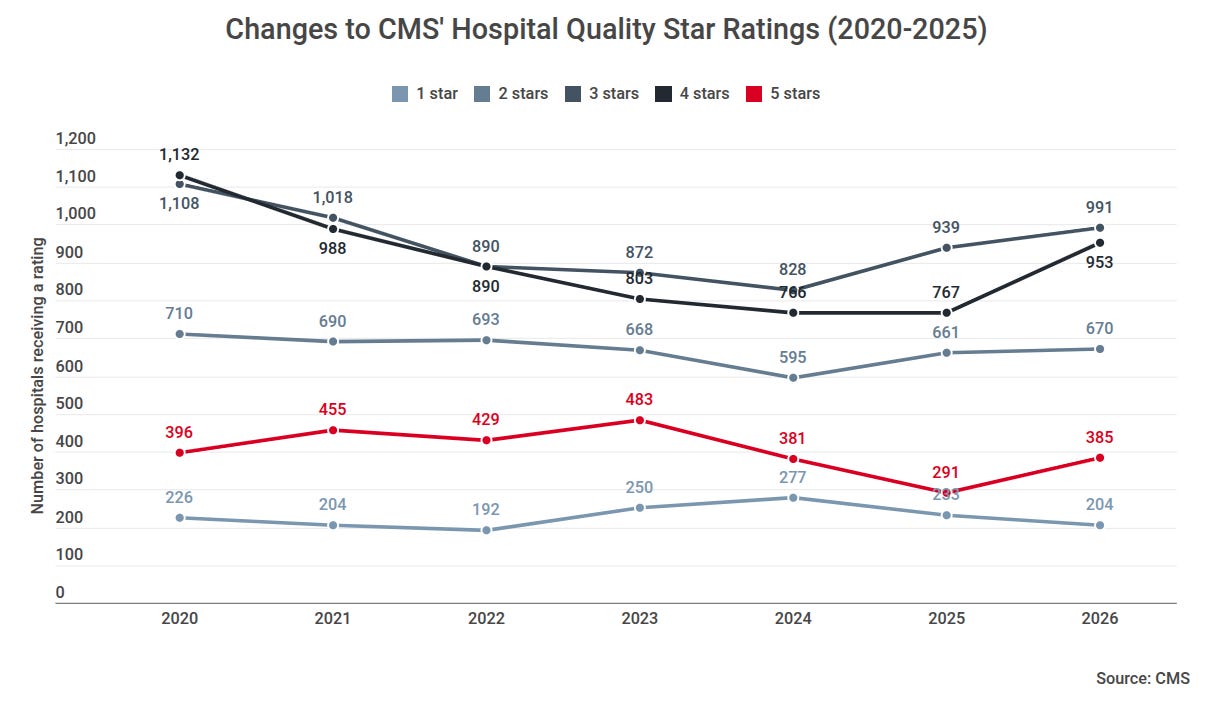
Changes to Hospital Quality Star Rating in US over the last 5 years
The methodology is still evolving. From 2027, hospitals in the lowest-performing quarter for safety, with enough safety measures to qualify, will lose one star from their overall rating, down to a minimum of one star.
England’s NHS publishes something called the Summary Hospital-level Mortality Indicator. Even its own guidance warns you shouldn’t treat it as a direct measure of how good a hospital is. It’s a flag that something might be worth investigating, not a verdict.
For our heart-surgery patient, an overall hospital grade would be a starting point. They’d still need to know how its cardiac unit performs.
When the score becomes the job
Goodhart’s law puts it simply: when a measure becomes a target, it can stop being a good measure.
Publish readmission rates, and hospitals have a reason to plan discharges better and improve follow-up care. That’s a good thing. But if deaths after surgery hurt their reputation, they may hesitate to take patients whose risks the rating doesn’t fully account for.
Early US research on cardiac-surgery report cards found evidence of hospitals becoming more selective about patients. Rating systems need to account for this risk, though it doesn’t mean every system leads to the same behaviour.
Even how hospitals keep records can change their scores.
Say a hospital starts recording more of the illnesses its patients already have. On paper, those patients now look sicker. The rating model expects worse outcomes, so the hospital’s actual results look better by comparison—even if the care hasn’t changed.
A US study found that changes in record-keeping explained a substantial share of the apparent improvement under a programme that fined hospitals for excessive readmissions. This doesn’t mean hospitals made up illnesses. They may simply have recorded conditions they previously missed. But a better score doesn’t always mean better care.
Medication errors pose a similar problem. A hospital that encourages staff to report mistakes could record more errors than one where staff stay quiet. As WHO cautions, these reports need careful interpretation. Rewarding the lowest reported count could end up rewarding silence.
That doesn’t make public reporting pointless. A systematic review found that it encouraged hospitals to work on improving care. But the effects on patient outcomes were uncertain. Publishing scores can get hospitals to act. Whether those actions help patients is a separate question.
India’s real challenge may be the data
For India, just gathering the information needed is a big task.
Say a patient leaves Hospital A after surgery, develops complications and is admitted to Hospital B. Hospital A’s records may show a successful discharge. Unless the two admissions are linked, the complication could be missing from its performance figures.
Deaths after discharge and recovery at home pose similar problems. Knowing what happened to a patient takes more than collecting a hospital’s monthly totals.
India already has parts of this infrastructure. The Health Management Information System collects routine data from healthcare facilities. PM-JAY generates claims records for hospital stays covered by the scheme. And the Ayushman Bharat Digital Mission, or ABDM, helps link digital health records and share them with consent.
These systems have considerable reach. By August 31, 2026, PM-JAY had supported 13.25 crore admissions in total. By September 17, roughly 97.61 crore ABHA health IDs had been created.
But a health ID isn’t a complete medical history. Hospital totals don’t tell us what happened to an individual patient. Claims cover care paid for under the scheme. And linked records only help if the relevant visits, treatments and medical details have been recorded.
To compare hospitals nationally, we’d need reliable information on patients’ health before treatment, the care they received and what happened afterwards—including outside the original hospital. Using the same definitions helps, but it cannot fill gaps in the records.
Start with what we can defend
India has proposed something similar before. In January 2023, the National Health Authority proposed grading PM-JAY hospitals on five indicators, including readmissions, patient satisfaction and improvements in health-related quality of life. It also promised a public dashboard.
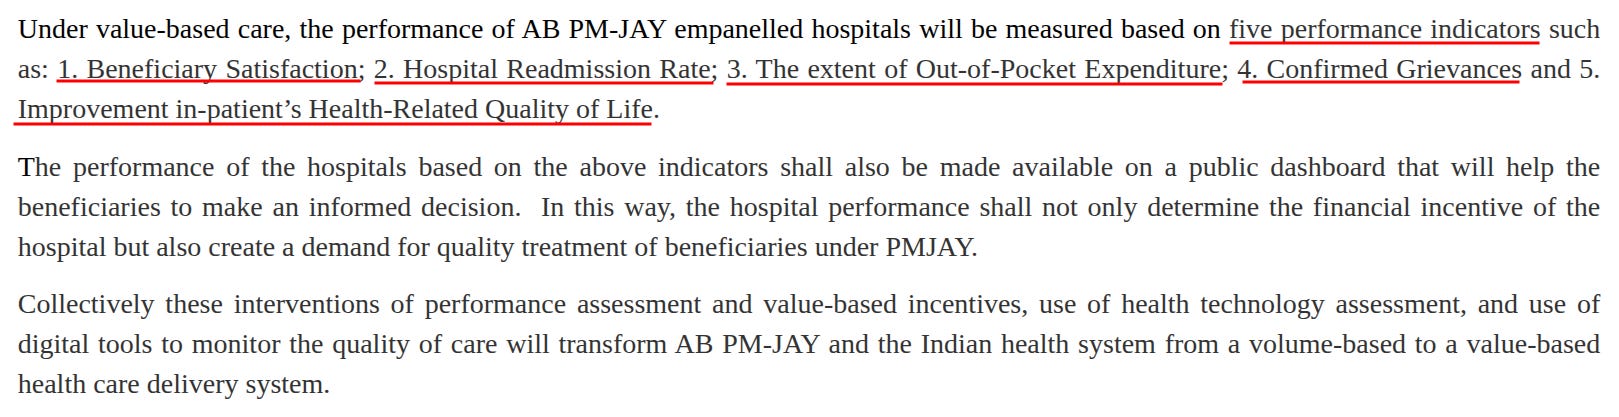
From PIB’s announcement in 2023
So there is a precedent. But the announcement alone doesn’t tell us how much was implemented, or whether the reported NITI framework would build on it.
For now, this remains a reported proposal. Its final methodology and rollout are still unsettled. The intention is welcome: patients shouldn’t have to choose hospitals largely by reputation and word of mouth.
But we’d rather have a smaller system with comparisons it can back up than a national leaderboard that makes us more certain than the evidence allows. Start with selected procedures and hospitals where patients can be followed up and results checked. Expand as the evidence improves.
Hospitals will respond to whatever gets rewarded. The test is whether the system gives them more reason to improve care than to make their numbers look better.
- This edition of the newsletter was written by Manie and Vignesh.
Tidbits
[1] India’s AI mission faces a GPU shortage
IndiaAI Mission has access to around 30,000 GPUs against the 45,000 committed by suppliers, as rising hardware costs make deliveries harder. The government is considering fresh bids to address the shortfall. A typical AI server now costs around ₹4 crore, nearly twice as much as a year ago, making computing capacity more expensive to expand.
Source: The Economic Times
[2] Electric two-wheelers surpass last year’s sales in nine months
India registered 15.61 lakh electric two-wheelers between January and September 2026, already exceeding the total for all of 2025. September registrations reached 1.97 lakh, up 7.7% from August, according to Vahan data. Compared with the same nine months last year, registrations grew around 62%.
Source: The Economic Times
[3] Cabinet approves ₹1.86 lakh crore green-energy corridor plan
The Cabinet has approved the third phase of the Green Energy Corridor programme, with an outlay of about ₹1.86 lakh crore. It includes transmission networks within states and 50 gigawatt-hours of battery storage. The plan aims to help renewable electricity reach consumers and store solar power for use after sunset, with completion targeted by FY33.
Source: The Indian Express
[4] New fuel-efficiency rules drop a separate concession for small cars
The government has notified new Corporate Average Fuel Economy rules, applicable from April 2027 to March 2032. They remove a proposed separate concession for small cars, but revise the overall formula to give lighter vehicle fleets relatively softer targets than the earlier draft. The rules also give electric vehicles and hybrids extra weight when calculating a carmaker’s compliance.
Source: Business Standard
[5] Porsche launches the electric Cayenne in India
Porsche has launched the electric Cayenne in India, with ex-showroom prices starting at around ₹1.77 crore. The higher-performance Turbo Electric starts at roughly ₹2.28 crore, and deliveries began on September 30. The electric SUV will be sold alongside the combustion-engine Cayenne, expanding Porsche’s electric range in India.
Source: Autopunditz
Want more tidbits? Catch up on last week’s recap!

Weekly Tidbits #7
·
3 Oct
Beyond Today’s Brief
There’s always more happening at Markets by Zerodha.
-
The Chatter: What regulatory shifts is the IRDAI Chairman prioritizing to deepen insurance penetration and drive industry growth? And how is Bajaj navigating the evolving landscape of credit and financial services?
-
Points & Figures: What does having a job even mean in today’s economy? And how are the blurring lines between formal employment, gig work, and underemployment complicating India’s labor market data?
-
Aftermarket Report: What dragged Nifty down further as its grueling losing streak extended to eight consecutive sessions? And how is the unrelenting sell-off impacting broader market sentiment and key sectors?
Join us on WhatsApp, where we share interesting soundbites from concalls, articles, and everything else we come across throughout the day. You’ll also get notified the moment a new video or article drops so that you can read or watch it right away.
Thank you for reading. Do share this with your friends and make them as smart as you are 