Is it good to invest in Nifty 500 value 50 index fund now? Currently it’s PE is 11. Hoping it is good to invest.
Looking for suggestions from bigger audience.
Is it good to invest in Nifty 500 value 50 index fund now? Currently it’s PE is 11. Hoping it is good to invest.
Looking for suggestions from bigger audience.
i mean… investing by just looking at pe?
I am checking PE to validate this index is under valued or over valued. So, if I double the SIP amount in under valued time frame, I can get the more NAV with cheaper price, right!
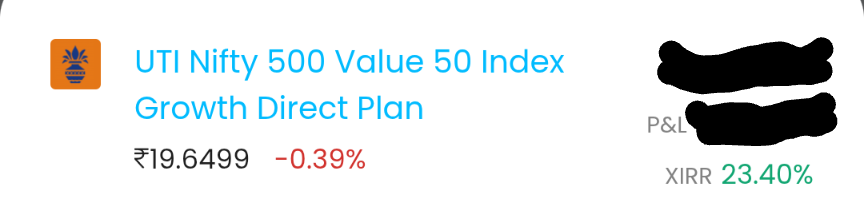
top holding is VEDL ![]()
I am not going to stop my SIP for my index funds, I hold them for very long period (more than a decade).
Are those 11 overlapped Nifty 50 stocks are having same weights in Nifty 50 as well? I don’t think so.
About Vedanta, is it good to judge the whole index based on single stock, even though there are many similar weights of other stocks?
Anyways, my concern is, with pe 11 this Index is under valued or not? If not, any other parameters should I chk to identify under valued Index? So that I can increase my SIP for sometime.
deleted the post no time for debate
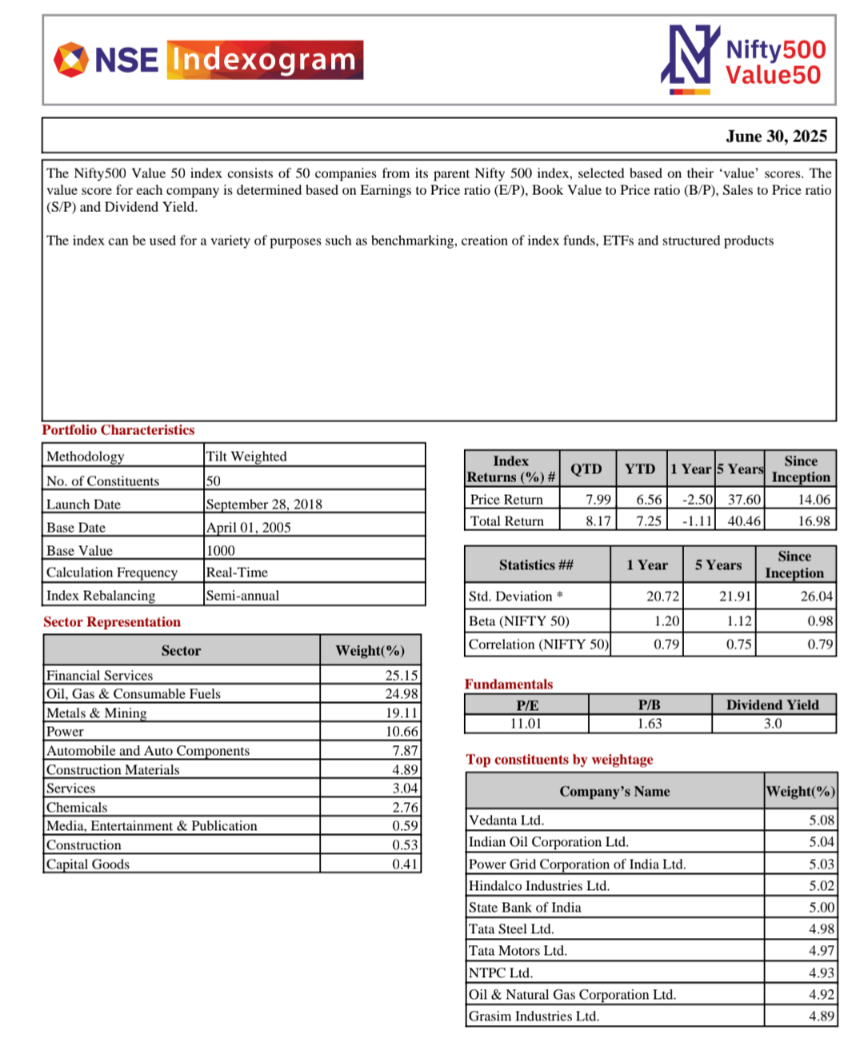
In a world where the PE ratios of NIFTY50, NIFTY100, NIFTY500, are all hovering around 20-25, this NIFTY500Value50, with a PE ratio of 11, looks undervalued.
However, do keep in mind that there is selection-bias at play here.
The NIFTY500 Value 50 Index picks 50 stocks from NIFTY500,
that fare high in the following 4 factors
(with equal weightage 25% given to each factor)
Earnings to Price ratio (E/P)
Book Value to Price ratio (B/P)
Sales to Price ratio (S/P)
Dividend Yield (Dividend/Price)
Source: https://niftyindices.com/Methodology/Method_NIFTY_Equity_Indices.pdf
As the methodology of the NIFTY500 Value 50 Index itself involves picking lower PE stocks,
no wonder the PE of the index is lower (and will continue to be)
compared to the other indices / overall market.
IMHO, the Nifty500Value50 index itself is not currently undervalued based on just the current PE of 11. @Natraj_G are there any other factors why you considered the index to be currently undervalued?
Here’s how i thought so far about investing in it -
What are the investment vehicles to get exposure to this index?
Thank you @cvs for the detailed explanation. Appreciate it. So, how should we read this Index? Is it good to invest for long-term? Is it good to be part of portfolio? Btw, This is the only Value based fund in my portfolio, others are momentum based.
I have got pretty good XIRR from past two years from when I started the investment. So, I thought of not stopping my investments. I agree, same XIRR may not repeat always. I believe, it may beat Nifty 500 and Nifty 50 indexes in a long run.
(Apologies in advance if this is too long-winded for the immediate question at hand.
Trying to cover all the bases for everyone who is reading along, or comes across this post in future.)
Before we begin, let’s get this slightly tangential aspect, out of the way first…
As we saw earlier in this thread, a key challenge with named strategy indices is that
Along the lines of how we saw that PE ratios of stocks on NIFTY500Value50 can be misleading if read without the context of the “value” index’s methodology (as they are expected to be lower than the average PE in the market). Similarly one would need to understand the methodology of the momentum indices being used to grasp the nuances involved.
Now let us focus on the NIFTY500Value50 index as an investment strategy
Without the complete context of the rest of one’s finances
(assets, liabilities, timelines, one’s goals).
the answer will be “it depends”.
Depends on how long of a long-term we are thinking of,
what phase we are in,
what phase we expect to be next/soon,
how long we expect to be in such a phase for, …
Let us continue think some more about this, until our heads hurt. ![]()
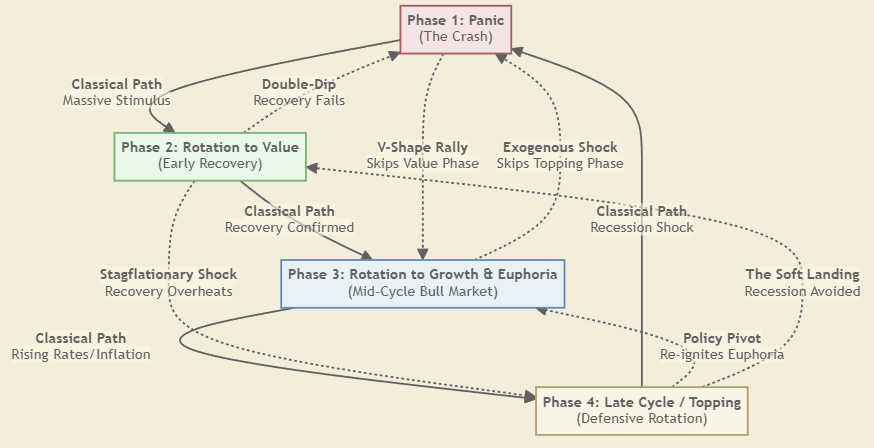
The NIFTY500Value50 index outperforming the NIFTY50,
depends on specific economic conditions.
economic recoveries, or periods of rising inflation and interest rates.
a speculative bubble bursts or valuations revert to their historical average.
In a major-crash or a broad-bull market, both these indices would move in the same direction.
Note: Which is what one would have observed while comparing these 2 indices over the recent times.
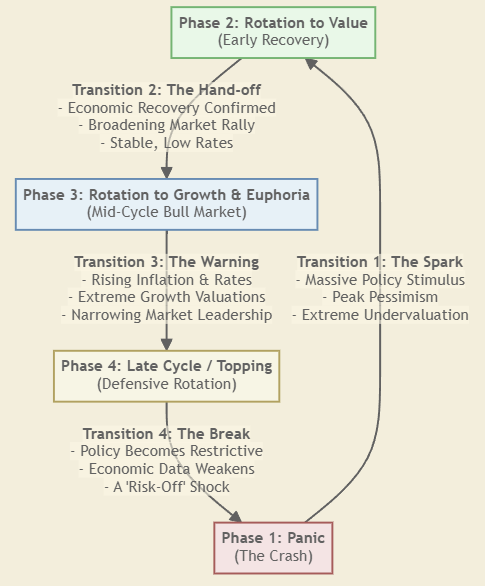
In theory, the NIFTY500Value50’s out-performance is primarily expected to occur
during “rotational” periods where investors shift from growth stocks to value stocks.
![]()
If one has obtained NIFTY50-like / NIFTY50-beating returns from NIFTY500Value50 in the recent times, it might be an indicator of where we are in the long-term cycle - “Rotation to Value”
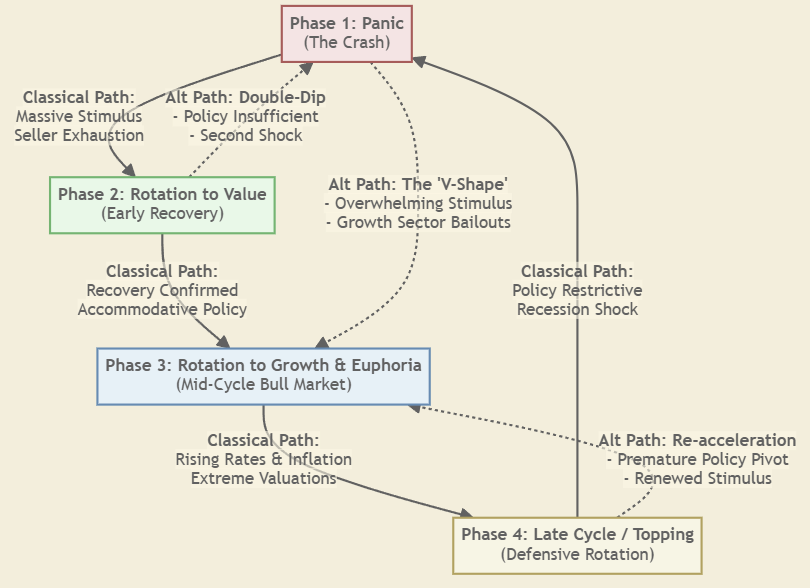
However, the market-cycle is rarely a simple linear recurring loop with straightforward transitions at periodic intervals.
And over the long-term, one never really knows
which transitions will actually occur, and when
So, over the long-long-term,
since we cannot predict the actual states, nor their durations, nor transitions
other factors (rather than the strategy)
will (or ideally should) dominate our decision making.
(to minimize the constant time/effort we would need to spend monitoring and reacting to an ever-changing market, all the while attempting to minimize portfolio churn.)
So, what are these “other factors” that should dominate the decision making?
Well, the answer, as always, is… “it depends”.
It depends entirely on you.
The specific investment strategy shouldn’t come first.
Your personal financial blueprint should.
Without it, we are just building on sand.
Let us think about the real foundation, piece by piece…
What are your actual goals? And what is the time horizon for each?
What is your true risk profile?
What is your current financial health?
… and then you can consider the logistics, like your personal tax situation, and how much knowledge and time you can honestly commit.
Only when all of that is crystal clear do we get to the final step of Portfolio Construction.
Does a NIFTY500Value50 fund fit into the target asset allocation?
Or are we just chasing returns we saw in the last two years?
This comprehensive self-assessment… understanding your own goals, risk, and finances… that is the essential work. The specific investment you choose is the very last brick to be laid, not the foundation itself.
Get the foundation right, and the strategy almost picks itself. ![]()
PS: @Natraj_G i sincerely hope all this “thinking out aloud” above in this post, helped you think through. Looking forward to your subsequent thoughts/conclusion after you digest all this and apply it on your own financials.
@cvs I thoroughly enjoyed your thoughts! I like to read and consume slowly such posts. Thanks for taking time and posting your views esp
Coming back to original question by OP @Natraj_G ,
NIFVALUE50 - Nifty500 Value 50 PE - Price to Earnings ratio of NIFVALUE50 is 10.80. View and compare historical PE ratios of on a chart with price and other fundamental ratios.
Current PE is Above 5Y average. as mentioned.
Any how one time investment is not going to make significance difference in wealth over long term disciplined SIP for average investor. One need to have some strategy to invest regularly to build wealth.
from Motilal Oswal website
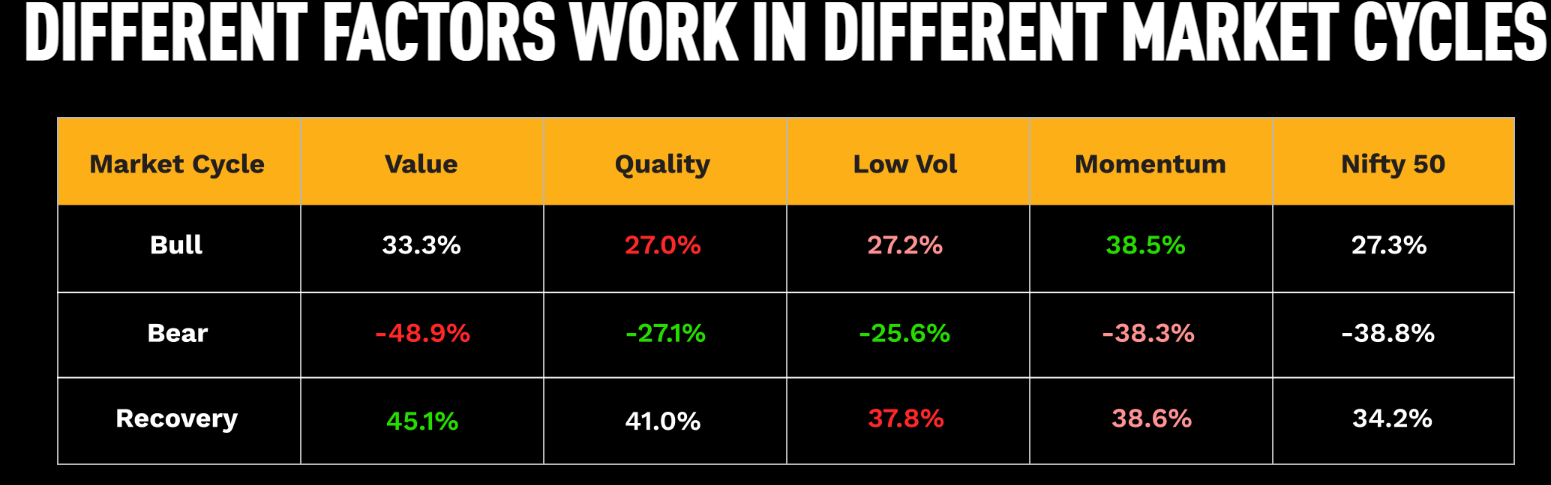
Depending on market cycle fund under/over performs.
if you really want to do long term investing based on PE probably you should consider all (major)factors. See How far todays PE from historical average and distribute your monthly investment amount in proportion to how low current PE is from average PE of that factor.
(Only)if some one is able to do it across all market cycles (say 10+ years ) of horizon there is probability that he/she may get higher returns than plain old boring SIP
PE calculation methodology changed after April 2021 ![]() and the prior years arent adjusted for this change…
and the prior years arent adjusted for this change…
2005 to 2020 returns must have been low for such large variation to occur btw 5 yr and ‘since inception’ backtest results.
Imo if you want to saddle a value fund with other agressive funds, it’s simpler to do it with a safer and more predictable Nifty 50 value 20 fund. Unless you have a 10+ yr horizon…