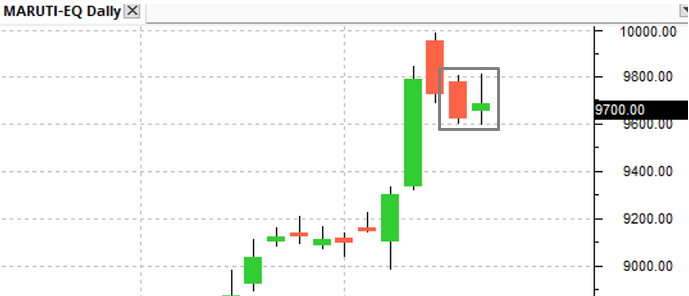
please share your views whether maruti daily chart qualifies for a bullish harami which formed on friday…

because, maruti is on a bullish uptrend for long… just 2 strong bearish sessions …
please share your views whether maruti daily chart qualifies for a bullish harami which formed on friday…
because, maruti is on a bullish uptrend for long… just 2 strong bearish sessions …
Theoretically it maybe somewhat as the latest candle covers up the preceding red candle entirely.
But the price movement usually has nothing to do with chart patterns. Maruti share may continue its upmove & u will conclude that it was bullish harami pattern. If the share price movement doesn’t moved up, you will conclude ohh it was not really a strong harami pattern!!
Hmm, but the Doji has to be completely engulfed within the downtrend candle for it to qualify as a bullish harami. That doesn’t seem to be the case here.
Its a bullish sign, but one needs to be very cautious
Ya it’s a sort of a harami pattern but in my perspective there’s not much of a downtrend before the pattern so I wouldn’t call it a strong pattern overall. 