Hi,
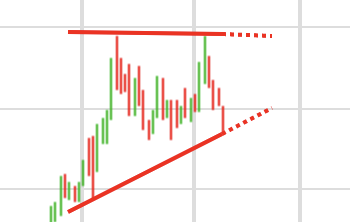
Is this (triangle?) bullish or bearish?
It is from gold monthly chart.
Thanks
Hi,
Is this (triangle?) bullish or bearish?
It is from gold monthly chart.
Thanks
Nobody has a crystal ball. And hence nobody can answer that without a pinch of over-confidence. Maybe when it crosses either of those dotted lines of yours the picture will be a bit clear but even then you can have false breakouts.
So TA works until it stops working. And this reminds me of a perfect quote to sum up your dilemma -
“I realized that technical analysis didn’t work when I turned the chart upside down and didn’t get a different answer.” — Warren Buffett.
Thanks. I understand no one has a crystal ball, but what does the set up (ascending triangle) looks like, bullish or bearish?
Technical Analysis works !!!. Rather than depending on theory which can have holes I prefer to mathematically create a model to analyse the market and decipher the odds of success via backtesting on data encompassing different kinds of market.
I suggest you do the same. There are coded and codeless platforms for you to do the same.
If there is something that cannot be mathematically defined it then becomes subjective and it is difficult to generate metrics for such systems unless it is live or paper traded for a fairly large period of time.
Ask 10 people and you will get 10 different answers.
so whatever you think is the final answer.
You don’t really have higher lows here yet. Best to use only easily visible highs and lows rather than getting creative to fit the pattern.
Generally higher lows into resistance ( esp within uptrend / or with recent momentum), consolidation around resistance is bullish - it is failure of rejection from resistance.
But rather than follow it blindly, back/forward test it and check the odds. That’s really the only way - you have to do your own work.
Thank you SpacemanSpiff. This pattern is actually generated by a trading platform automatically (automated pattern recognition) and is marked as bearish. Probably marked bearish because no higher lows.
And these automated pattern recognition software are not perfect.
I don’t think it is showing any trend now. Let it move a little further, then might be, we are able to predict a proper trend.
There is no perfection in any pattern. You only get probabilities - If you take 1000 trades, in some you lose some you win. If difference is positive enough then you have edge. Most patterns probably don’t have any edge. To complicate further, market behaviour can shift too. Nothing is set in stone and patterns that worked earlier can stop working.
learn about the way professional gamblers think, it will immensely help
it will definitely help you.
The trend is hard to identify. If you identify such patterns, wait for some time until you don’t see any ambiguity. That’s how I go by.
It’s hard to tell. If this happens to me, I wait and then make a decision.
No one can tell with absolute certainty whether the pattern is bullish or bearish. Test yourself and figure out what happens. You will learn better that way.
This is a very complex pattern; you can wait for some other indication before taking any action. Once there is clarity, you can go ahead and make your decision.
I would say it could be bullish or bearish only when there is enough stop loss that mean if there is liquidity on top of the pattern means there is stop loss then it will fake breakout and will go bearish. Means that high-LH-LH or Low-HL-HL like pattern that in most scenerio it would fake breakout to most stop loss position and turn reverse. But If the trend is uptread and pattern position is bottom or middle it will generally breakout. But if it form on top of chart or swing it is likely to go breakin. You have to do multiple time frame analysis whether there is double marubuzu or engulfing candle formed on this pattern and there position. If pattern formed on resistance and candle is bearish than smart money want it in this price range.