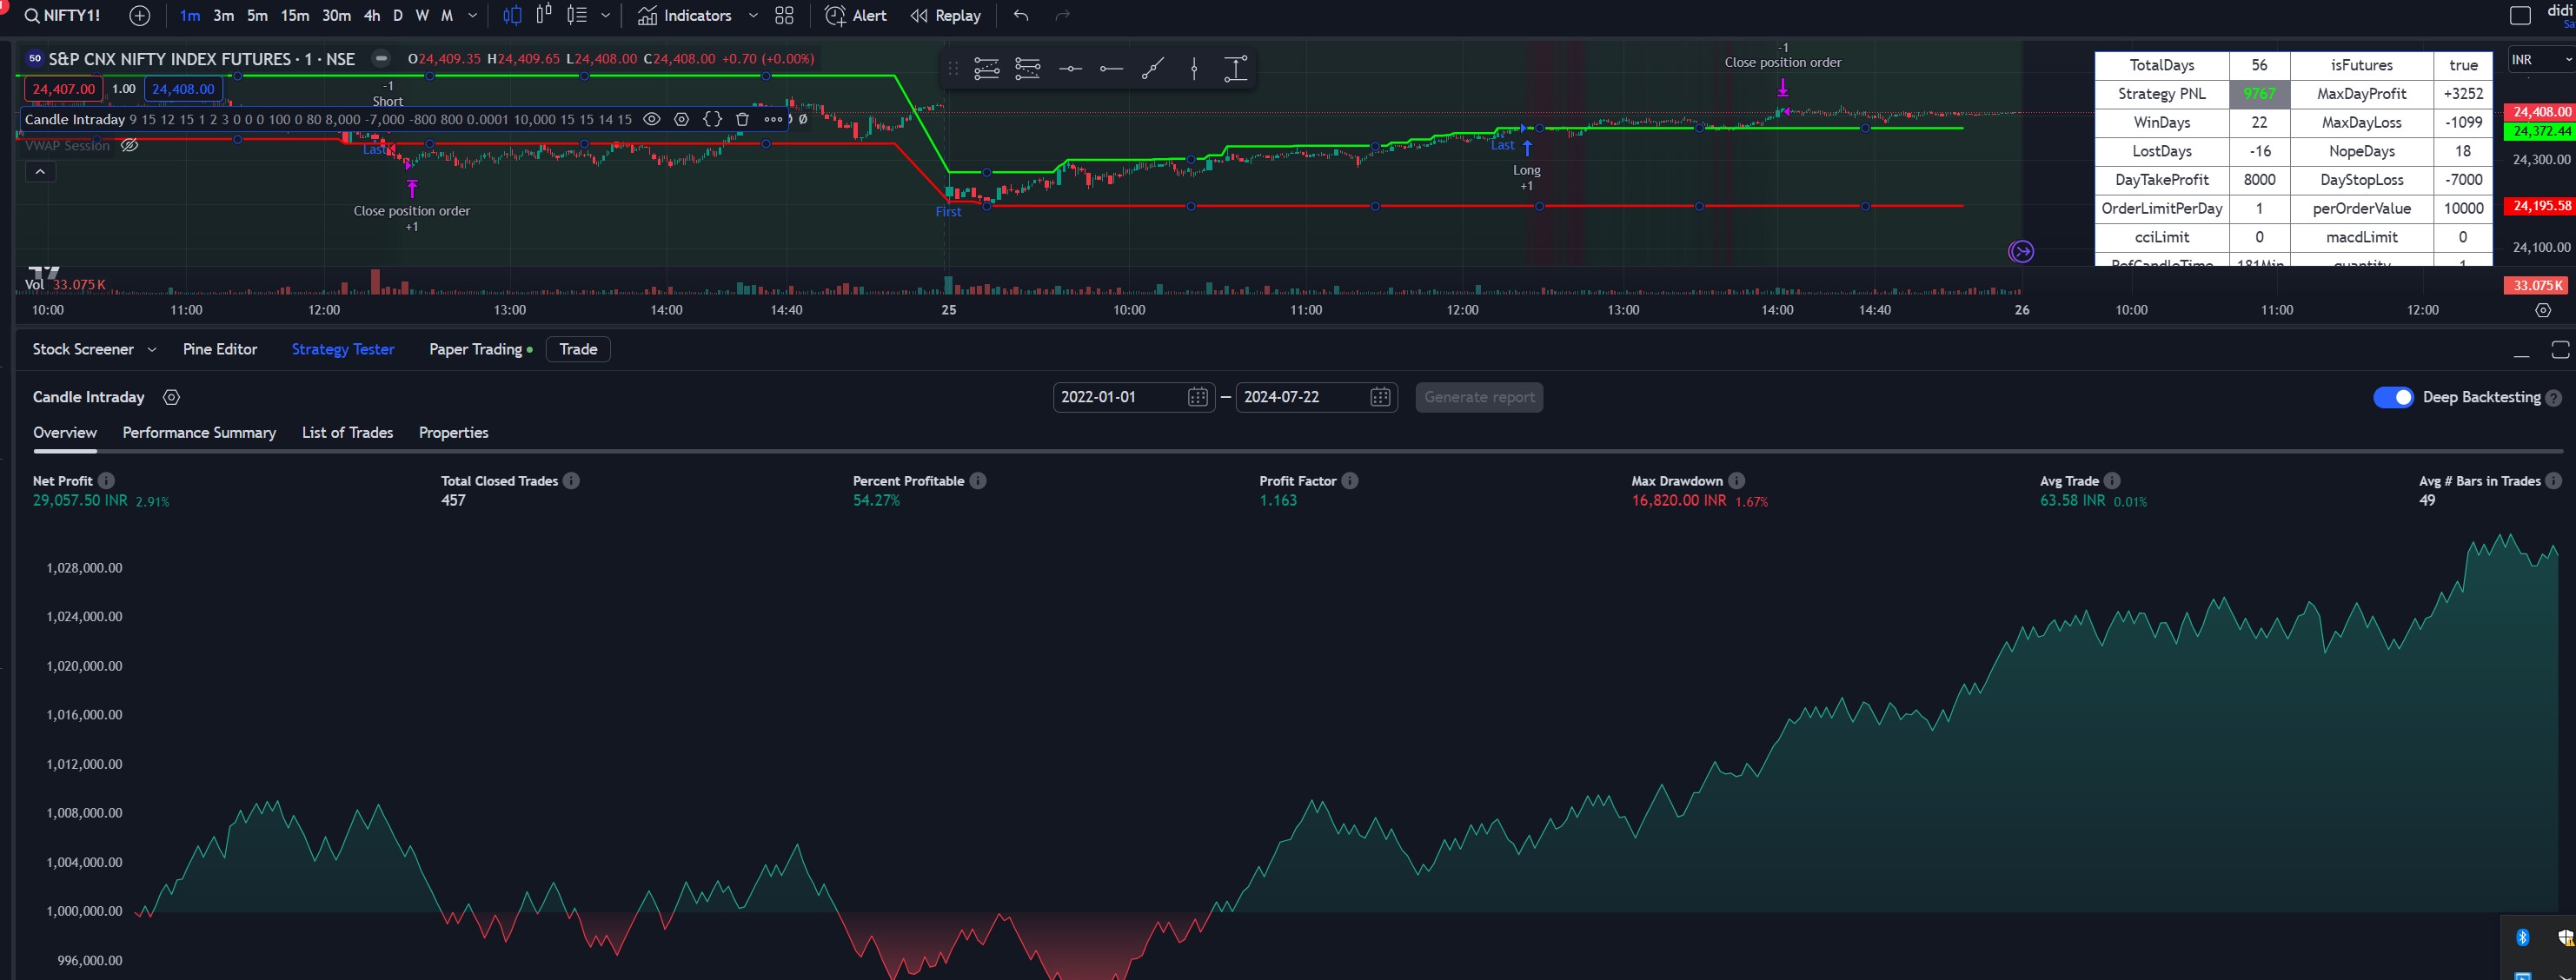
First, i will choose 1 hour time frame 11:15 to 12:15 chart and mark the high-low of candle. now switch to 3 min chart and as the 3 min candle breaks the high and low of the candle, i choose long or short. my SL will be low and high of the same candle
Not good for nifty and bank nifty.
this script, had some other indicators, to make them invalid, set macd limit 0 , cci to 0 ,like that . ci chopiness index to 1000,like that ,use indicator values against to its reference values .
//@version=5
strategy("Candle Intraday", overlay=true ,calc_on_every_tick =true )
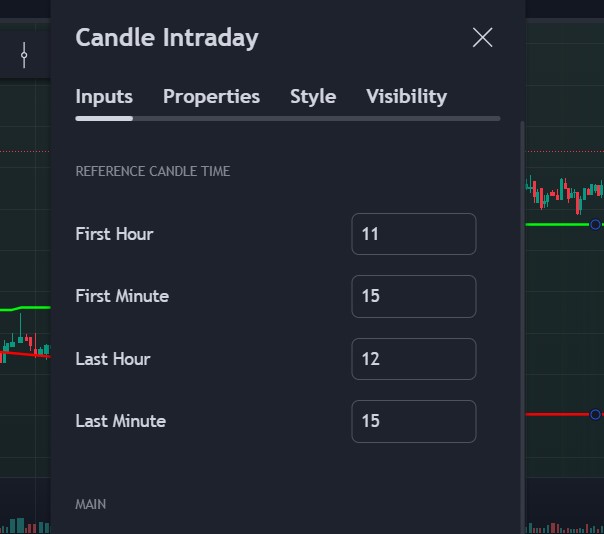
FirstCandleHour = input.int(defval=9, title="First Hour", minval=1,group = "Reference Candle Time")
FirstCandleMinute =input.int(defval=15, title="First Minute", minval=0,group = "Reference Candle Time")
LastCandleHour = input.int(defval=9, title="Last Hour", minval=1,group = "Reference Candle Time")
LastCandleMinute =input.int(defval=30, title="Last Minute", minval=0,group = "Reference Candle Time")
orderLimit = input.int(defval=4, title="Order Limit per Day", minval=1,group = "Main")
MinOrderLifeBars = input.int(defval=2, title="MinOrderLifeBars", minval=1,group = "Main")
nofVolumeCandles = input.int(3, title="Number of Lastc CandleVolume",group = "Volume")
VolumeLimit = input.int(0, title="VolumeLimitToCross",group = "Volume")
// Inputs for the strategy
cciLimit = input.int(defval=0, title="cciLimit", minval=0,group = "Indicators")
rsiUpLimit = input.int(defval=0, title="rsiUpLimit", minval=0,group = "Indicators")
rsiDownLimit = input.int(defval=100, title="rsiDownLimit", minval=0,group = "Indicators")
macdLimit = input.float(defval=0, title="macdLimit", minval=0,step=0.01,group = "Indicators")
ciLimit = input.float(defval=80, title="ciLimit", minval=0,step=0.01,group = "Indicators")
dailyPnLTakeProfit = input.int(defval=2000, title="Daily PnL Limit",group = "Orders")
dailyPnLStopLoss = input.int(defval=-1200, title="dailyPnLStopLoss",group = "Orders")
StopLossPerOrder =input.int(defval=-900, title="StopLossPerOrder",group = "Orders")
TakeProfitPerOrder =input.int(defval=1000, title="TakeProfitPerOrder",group = "Orders")
showHighLowLines = input.bool(defval = true,title = "Draw Lines")
AdditionalPercentage =input.float(defval=0.0001, title="AdditionalPercentageToHighLow", minval=0,step=0.0001)
perOrderValue = input.int(defval=10000, title="perOrderValue", minval=1000)
endHour = input.int(defval=15, title="EOD Hour", minval=1,group = "Intraday ")
endMinute =input.int(defval=15, title="EOD Minute", minval=0,group = "Intraday ")
orderEndHour = input.int(defval=14, title="OrderEod Hour", minval=1,group = "Intraday ")
orderEndMinute =input.int(defval=15, title="OrderEOD Minute", minval=0,group = "Intraday ")
isOrderEOD = (hour(time) <= orderEndHour)
// Initialize a counter to track the number of orders per day
var int orderCount = 0
// Get the current day
var int totalDays = 0
var int Windays=0
var int LostDays=0
var int firstCandleBarIndex = na
var int CandleBarIndex = na
var float CandleHigh4 = 0
var float CandleLow4 = 0
var float DayHigh = 0
var float DayLow = 0
var float DayOpen = 0
var float DayClose = 0
var float dailyPnL = 0.0
var bool dayTakeProfitReached = false
var float runningPnl=0
var int LastOrderType =0
var float MaxPnl=0
var float MinPnl=0
var bool StoptradingForDay = false
var int NopeDays =0
var bool isOrderRunning = false
// Check if it's the end of the day
isEndOfDay = (hour(time) == endHour and minute(time) == endMinute)
if (runningPnl < dailyPnLStopLoss)
StoptradingForDay:=true
// Close all trades at the end of the day
if (isEndOfDay)
LastOrderType:=0
strategy.close_all("EOD","EOD")
orderCount := 0
MaxPnl:=math.max(runningPnl,MaxPnl)
MinPnl:=math.min(runningPnl,MinPnl)
DayHigh := na
DayLow := na
if(runningPnl < 0)
LostDays :=LostDays-1
if(runningPnl > 0)
Windays :=Windays+1
if (runningPnl==0)
NopeDays:=NopeDays+1
// Reset daily stats on new day
if (dayofweek != dayofweek[1])
isOrderRunning:=false
StoptradingForDay:=false
isEndOfDay:=false
LastOrderType:=0
dailyPnL := strategy.netprofit
dayTakeProfitReached := false
totalDays :=totalDays+1
orderCount := 0
DayHigh := 0
DayLow := 0
firstCandleBarIndex:=0
isFirstCandle = (hour(time) == FirstCandleHour) and (minute(time) == FirstCandleMinute)
isLastCandle = (hour(time) == LastCandleHour) and (minute(time) == LastCandleMinute)
isLastCandleCrossed = (hour(time) < LastCandleHour) or ( hour(time) == LastCandleHour and minute(time) < LastCandleMinute)
if (isFirstCandle)
firstCandleBarIndex := bar_index
if (isLastCandle)
CandleBarIndex := bar_index
var float time1 = na
var float time2 = na
if (bar_index ==firstCandleBarIndex)
DayOpen := open
DayClose := close
DayLow := low
DayHigh := high
time1 := time
if ( DayOpen !=0 and isLastCandleCrossed )
DayHigh := math.max(DayHigh, high *(1+AdditionalPercentage))
DayLow := math.min(DayLow, low *(1-AdditionalPercentage))
plotshape(series= bar_index== firstCandleBarIndex and showHighLowLines, location=location.belowbar, color=color.blue, style=shape.diamond, text="First", title="FirstCandle")
plotshape(series= bar_index== CandleBarIndex and showHighLowLines, location=location.belowbar, color=color.blue, style=shape.diamond, text="Last", title="LastCandle")
var float timeDiff=0
if (bar_index == CandleBarIndex+1)
time2 := time
timeDiff := ((time2 - time1)/ 60000)
plot(showHighLowLines ? DayHigh > 0?DayHigh:na : na, color=#00fe08fb, linewidth=2, title="Candle High")
plot(showHighLowLines ? DayLow>0?DayLow:na : na, color=#f70000, linewidth=2, title="Candle Low")
// Track running PnL
runningPnl := (strategy.netprofit - dailyPnL)+ strategy.opentrades.profit(strategy.opentrades - 1)
plot(showHighLowLines ? na : runningPnl, title="Running PnL", color=runningPnl >= 0 ? color.green : color.red, style=plot.style_area)
// Calculate combined volume
combined_volume = 0.0
for i = 0 to nofVolumeCandles - 1
combined_volume := combined_volume + volume[i]
combined_volume :=combined_volume/1000
cciVal = ta.cci(hlc3,20)
fastMA = ta.ema(close, 12)
slowMA = ta.ema(close, 26)
macd = fastMA - slowMA
ci = 100 * math.log10(math.sum(ta.atr(1), 14) / (ta.highest(14) - ta.lowest(14))) / math.log10(14)
rsi = ta.rsi(close,14)
isOpenOkay = not na(DayHigh) and not na(DayLow)
mainCondition1 = isOpenOkay and isOrderEOD and combined_volume > VolumeLimit and ci < ciLimit and bar_index > CandleBarIndex and strategy.opentrades.size(0) == 0 and orderCount < orderLimit and dayTakeProfitReached == false and strategy.opentrades == 0 and StoptradingForDay==false
longCondition = mainCondition1 and close > DayHigh and cciVal > cciLimit and macd > macdLimit and rsi > rsiUpLimit and LastOrderType !=1
shortCondition = mainCondition1 and close < DayLow and cciVal < -cciLimit and macd < -macdLimit and rsi < rsiDownLimit and LastOrderType !=-1
plot(showHighLowLines ? na : cciVal, title="cciVal", color=color.blue, style=plot.style_area)
//longCondition = mainCondition1 and close > DayHigh and cciVal > cciLimit and macd > macdLimit and LastOrderType !=1 and rsi > 70
//shortCondition = mainCondition1 and close < DayLow and cciVal < -cciLimit and macd < -macdLimit and LastOrderType !=-1 and rsi < 30
var float quantity = int(perOrderValue*5/DayHigh)
// Get the current symbol's name
symbolName = syminfo.tickerid
// Define suffixes for different types (this is just an example, adjust as needed)
isFutures = str.contains(symbolName, "1!")
if (isFutures)
quantity:=1
var int orderRunTime = na
// Place orders based on the close price
if (longCondition)
LastOrderType :=1
orderCount += 1
isOrderRunning:=true
orderRunTime := bar_index
strategy.entry("Long", strategy.long,qty=quantity)
alert('{"Symbol": "' + syminfo.ticker + '", "Action": "Buy", "Remarks":"Starting"}', alert.freq_once_per_bar_close)
if ( shortCondition )
LastOrderType :=-1
orderCount += 1
isOrderRunning:=true
orderRunTime := bar_index
strategy.entry("Short", strategy.short,qty=quantity)
alert('{"Symbol": "' + syminfo.ticker + '", "Action": "Sell", "Remarks":"Starting"}', alert.freq_once_per_bar_close)
if (strategy.opentrades != 0)
if (LastOrderType > 0)
if(close < DayLow)
strategy.close_all()
if (LastOrderType < 0)
if(close > DayHigh)
strategy.close_all()
var int StopLossHits =0
var int TakeProfitHits =0
//StopLossPerOrder
if (strategy.opentrades.profit(strategy.opentrades - 1) < StopLossPerOrder and ( bar_index > orderRunTime + MinOrderLifeBars))
strategy.close_all()
StopLossHits := StopLossHits +1
if (strategy.opentrades.profit(strategy.opentrades - 1) > TakeProfitPerOrder and (bar_index > orderRunTime +MinOrderLifeBars))
strategy.close_all()
TakeProfitHits:=TakeProfitHits+1
if(runningPnl > dailyPnLTakeProfit )
dayTakeProfitReached := true
strategy.close_all()
if (isOrderRunning and strategy.opentrades ==0)
if (LastOrderType > 0)
alert('{"Symbol": "' + syminfo.ticker + '", "Action": "Sell", "Remarks":"Closing"}', alert.freq_once_per_bar_close)
if (LastOrderType < 0)
alert('{"Symbol": "' + syminfo.ticker + '", "Action": "Buy", "Remarks":"Closing"}', alert.freq_once_per_bar_close)
isOrderRunning := false
if( open > DayLow and open < DayHigh and strategy.opentrades ==0 and (bar_index > orderRunTime + 30))
LastOrderType:=0
normalizedPnL = (runningPnl + 2000) / 5000 * 20
// Set background colors based on conditions
bgcolor(runningPnl >= 0 ? color.new(color.green, 100- normalizedPnL) : color.new(color.red, 100-normalizedPnL), title="Up Background")
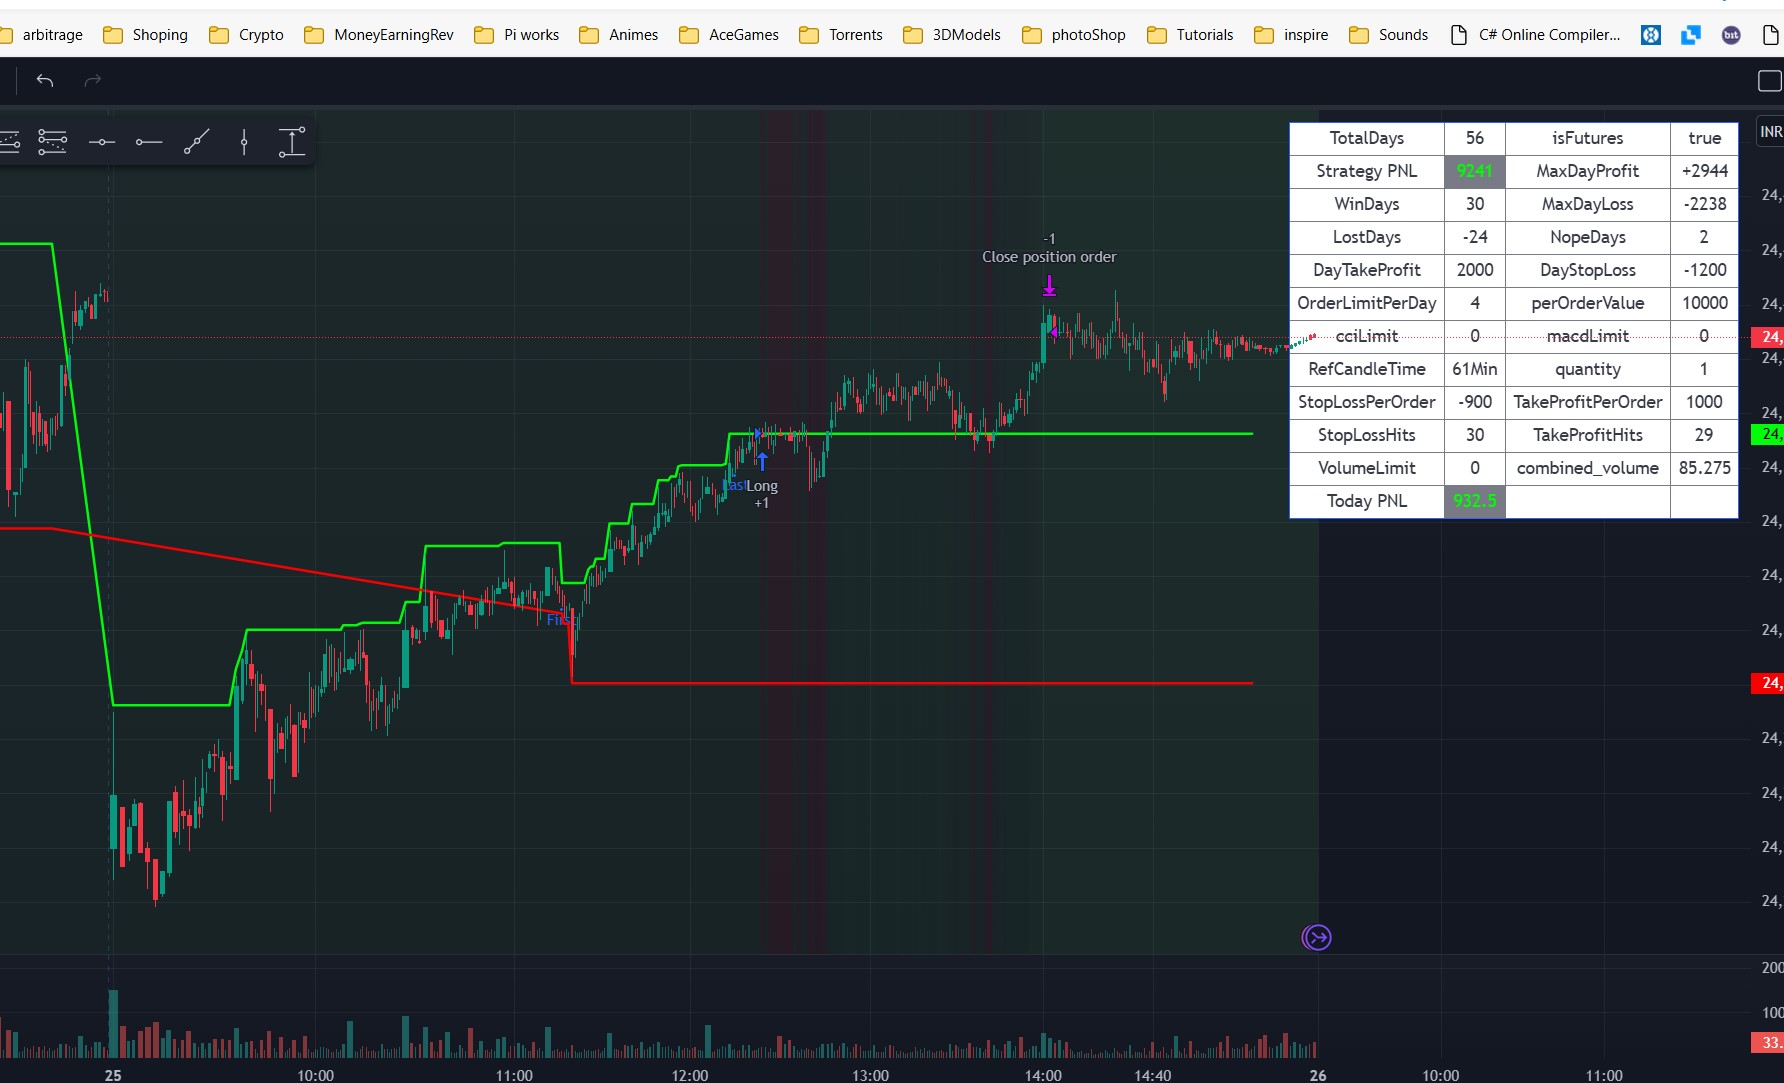
// Create table
var table myTable = table.new(position.top_right, 6, 18,bgcolor = color.white,frame_color = color.blue,frame_width = 1,border_color = color.gray,border_width = 1)
// Populate table
if barstate.isnew or barstate.islast
table.cell(myTable, 0, 0, "TotalDays")
table.cell(myTable, 1, 0, str.tostring( totalDays))
table.cell(myTable, 2, 0, "isFutures")
table.cell(myTable, 3, 0, str.tostring( isFutures) )
table.cell(myTable, 0, 1, "Strategy PNL")
table.cell(myTable, 1, 1, str.tostring(math.round(strategy.netprofit)) , text_color =strategy.netprofit > 0 ? #00ff00 : color.red ,bgcolor = color.gray)
table.cell(myTable, 2, 1, "MaxDayProfit")
table.cell(myTable, 3, 1, "+"+str.tostring(math.round(MaxPnl)))
table.cell(myTable, 0, 2, "WinDays")
table.cell(myTable, 1, 2, str.tostring(Windays))
table.cell(myTable, 2,2, "MaxDayLoss")
table.cell(myTable, 3, 2, str.tostring(math.round(MinPnl)))
table.cell(myTable, 0, 3, "LostDays")
table.cell(myTable, 1, 3, str.tostring(LostDays))
table.cell(myTable, 2, 3, "NopeDays")
table.cell(myTable, 3, 3, str.tostring(NopeDays))
table.cell(myTable, 0, 4, "DayTakeProfit")
table.cell(myTable, 1, 4, str.tostring(dailyPnLTakeProfit))
table.cell(myTable, 2, 4, "DayStopLoss")
table.cell(myTable, 3, 4, str.tostring(dailyPnLStopLoss))
table.cell(myTable, 0, 5, "OrderLimitPerDay")
table.cell(myTable, 1, 5, str.tostring(orderLimit))
table.cell(myTable, 2, 5, "perOrderValue")
table.cell(myTable, 3, 5, str.tostring(perOrderValue))
table.cell(myTable, 0, 6, "cciLimit")
table.cell(myTable, 1, 6, str.tostring(cciLimit))
table.cell(myTable, 2, 6, "macdLimit")
table.cell(myTable, 3, 6, str.tostring(macdLimit))
table.cell(myTable, 0, 7, "RefCandleTime")
table.cell(myTable, 1, 7, str.tostring(timeDiff)+"Min")
table.cell(myTable, 2, 7, "quantity")
table.cell(myTable, 3, 7, str.tostring(quantity))
table.cell(myTable, 0, 8, "StopLossPerOrder")
table.cell(myTable, 1, 8, str.tostring(StopLossPerOrder))
table.cell(myTable, 2, 8, "TakeProfitPerOrder")
table.cell(myTable, 3, 8, str.tostring(TakeProfitPerOrder))
table.cell(myTable, 0, 9, "StopLossHits")
table.cell(myTable, 1, 9, str.tostring(StopLossHits))
table.cell(myTable, 2, 9, "TakeProfitHits")
table.cell(myTable, 3, 9, str.tostring(TakeProfitHits))
table.cell(myTable, 0, 10, "RsiUpLimit")
table.cell(myTable, 1, 10, str.tostring(rsiUpLimit))
table.cell(myTable, 2, 10, "RsiDownLimit")
table.cell(myTable, 3, 10, str.tostring(rsiDownLimit))
table.cell(myTable, 0, 10, "VolumeLimit")
table.cell(myTable, 1, 10, str.tostring(VolumeLimit))
table.cell(myTable, 2, 10, "combined_volume")
table.cell(myTable, 3, 10, str.tostring(combined_volume))
table.cell(myTable, 0, 11, "Today PNL")
table.cell(myTable, 1, 11, str.tostring(runningPnl), text_color =runningPnl > 0 ? #00ff00 : color.white ,bgcolor = color.gray)