Amey1
March 28, 2025, 12:09pm
1
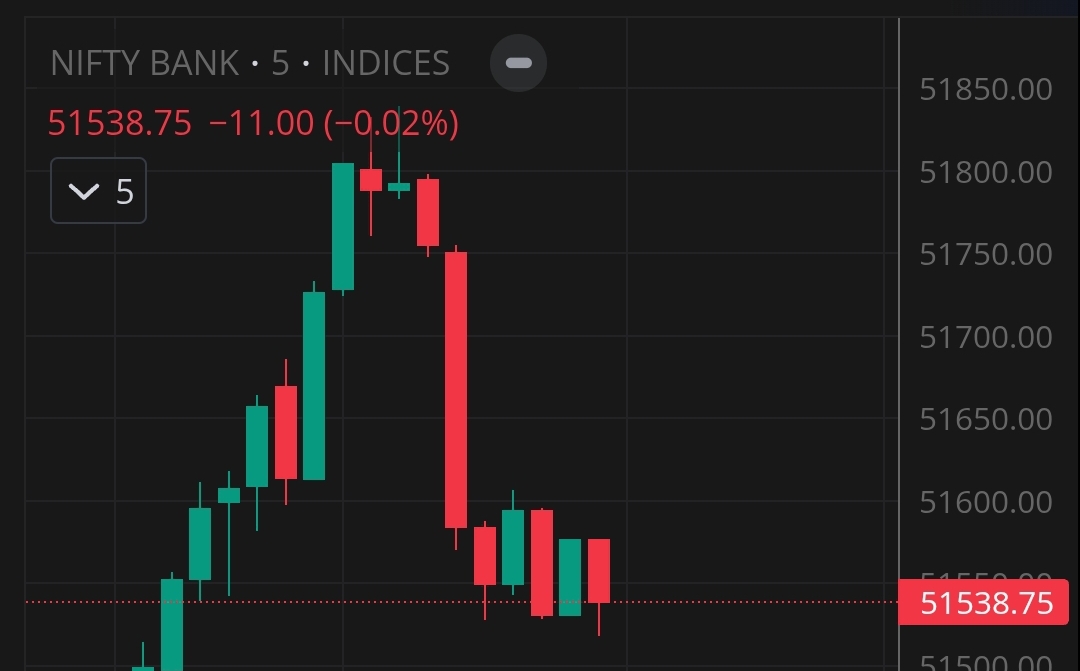
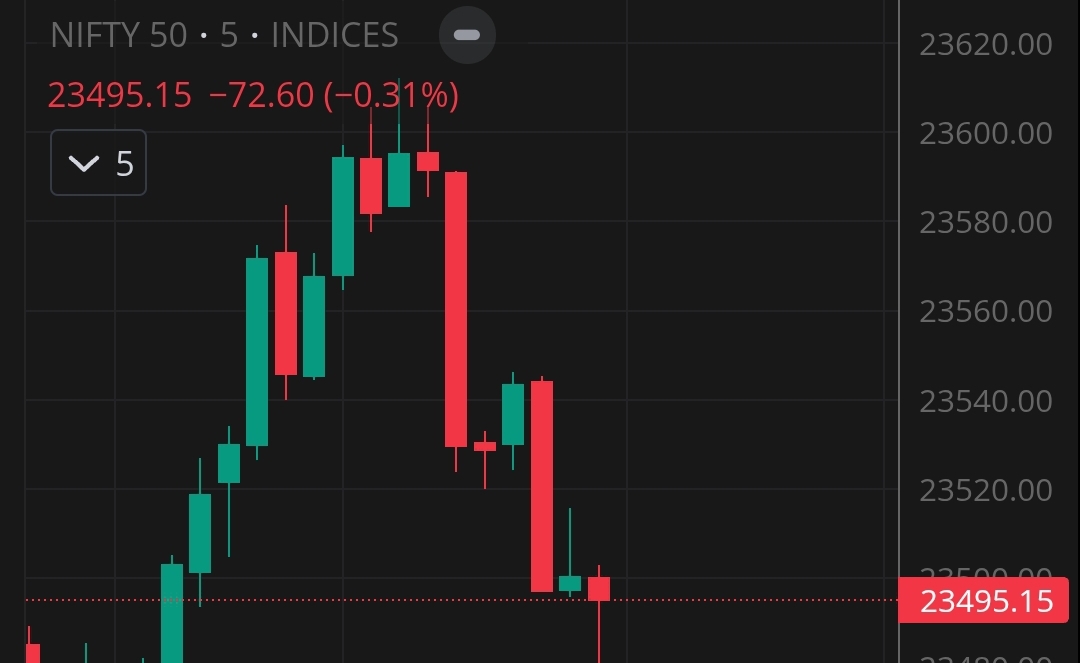
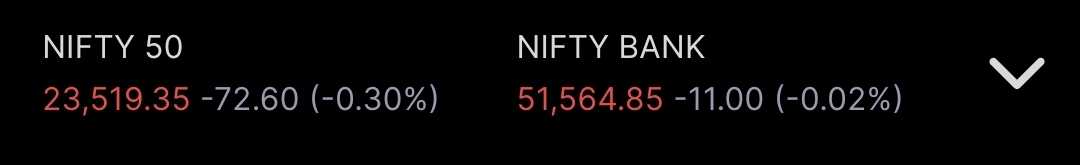
I checked the index close price the ticker shows correct closure price but chart is showing incorrect price PFA SS
Randomly checked 2-3 stocks same I see ticker price is different & closure price is different. But difference on chart price & ticker price is not that much which index prices r showing
Hi @Amey1 , yu are comparing the final closing price with the Last Traded Price (LTP) seen on charts.
The final closing price is the weighted average price of the last 30 minutes of trading and is updated on Kite a few minutes after the market closes.
Closing price is calculated as the weighted average price of the last 30 minutes, whereas the LTP, as the name suggests is the last traded price..
I've illustrated the same below...
[image]
If you notice, the LTP in our example is 54 (@ 3:30 PM), but the closing price is 51.48. Also, if you see the volumes, the big ticket order 3:25 PM actually skewed the closing price.
A lot of trading stratgies actaully consider closing price as a key input for entry or exit...one way to ensure that your …
Btw, yu can use the Anchored VWAP indicator available in ChartIQ and Trading View charts to get an approximate idea of where the market will close.
Hi @npstocktrader , it’s the weighted average price of the last 30 minutes of trading.
You can use the Anchored VWAP indicator available in ChartIQ and Trading View charts to get an approximate idea of where the market will close.
In TradingView charts, follow the steps in the screenshot, and make sure to select the candle starting at 3:00 PM.
[GWdsDIjW0AQpx5E]