Want to add support ,resistance levels and pivot points to the chart ,how it can be done ?
Depends on which chart you are using.
On Trading View.
To add the Pivot Point indicator, just go to Indicators and type “Pivot Points”.
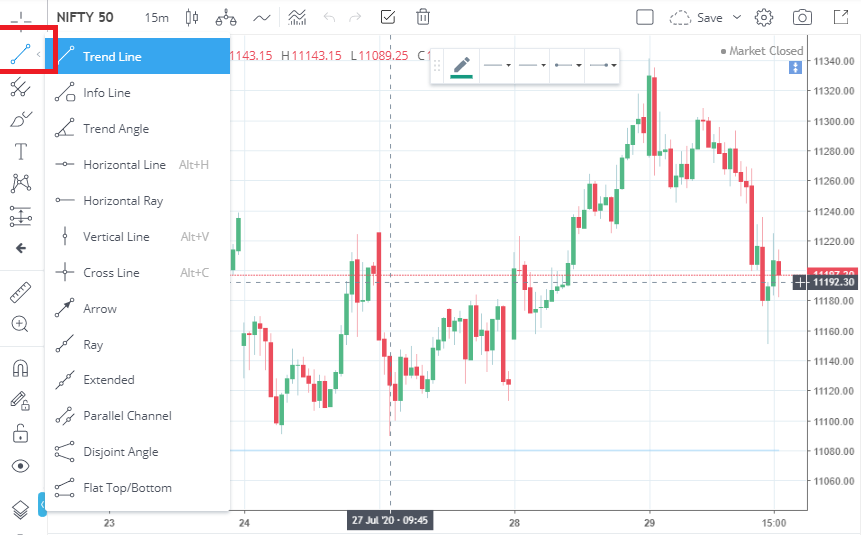
You can select tools to draw S/R lines from here…
On ChartIQ, you can add Pivot Point indicator from Studies.
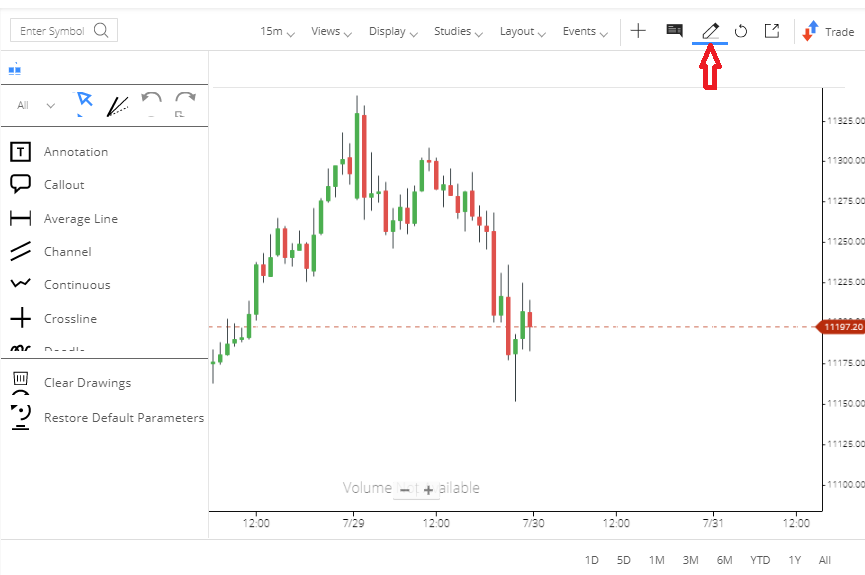
You can find tools to draw S/R lines in ChartIQ here…
Understood ,but how can we find the support and resistance for that entity?
You can learn how to draw Support and Resistance here