Lets Talk with Charts?

Let’s create a thread where charts can be discussed.

Note : Please don’t use this thread as messaging platform. Try to write as many details as possible in one entry. Also do the same while asking any questions.

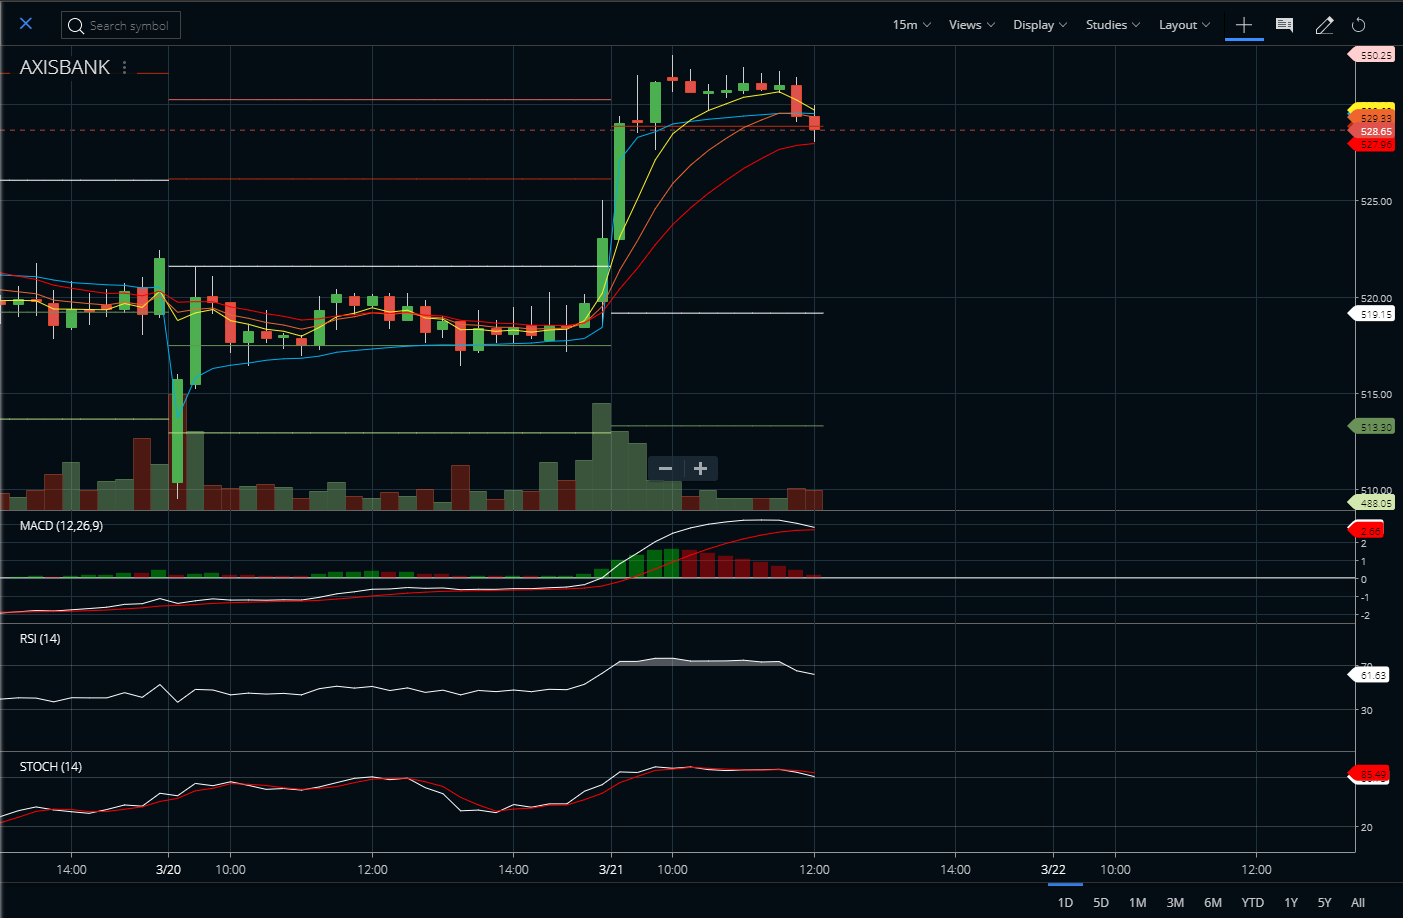
Personally I use 15 minutes charts for intraday and daily, weekly and monthly for positional positions.

4 Likes

i used 4 hour chart frame for investigation

and you


Keep #JetAirways in radar. It is taking support near trendline. If it break, it will touch 675, 655 soon.

For more such trade setup visit this link

1 Like

First target reached on :joy::joy: 670.0 so far.


Keep #BIOCON in radar. It’s trading very close to trendline. If breakout happens, 555 and 535 can be seen very soon.

For more such trade setup visit this link

If tomorrow close below 650 then it’s a positional short for almost 50 points as per master candle.

Keep #Sunpharma in radar for #ShortTerm.

  1. Bullish Engulfing pattern formed on daily chart with good volume.
  2. Stock has bounced back from strong support reason of 492-496.
  3. Buy only above 512.0

For more such trade setup visit this link

Keep #Raymond in radar for #ShortTerm.

  1. It’s taking support near trendline.
  2. Quick bounce back might be seen from current level. 940, 965, 1000 is possible in 1 month period.

For more such trade setup visit this link

Can anyone explain this?

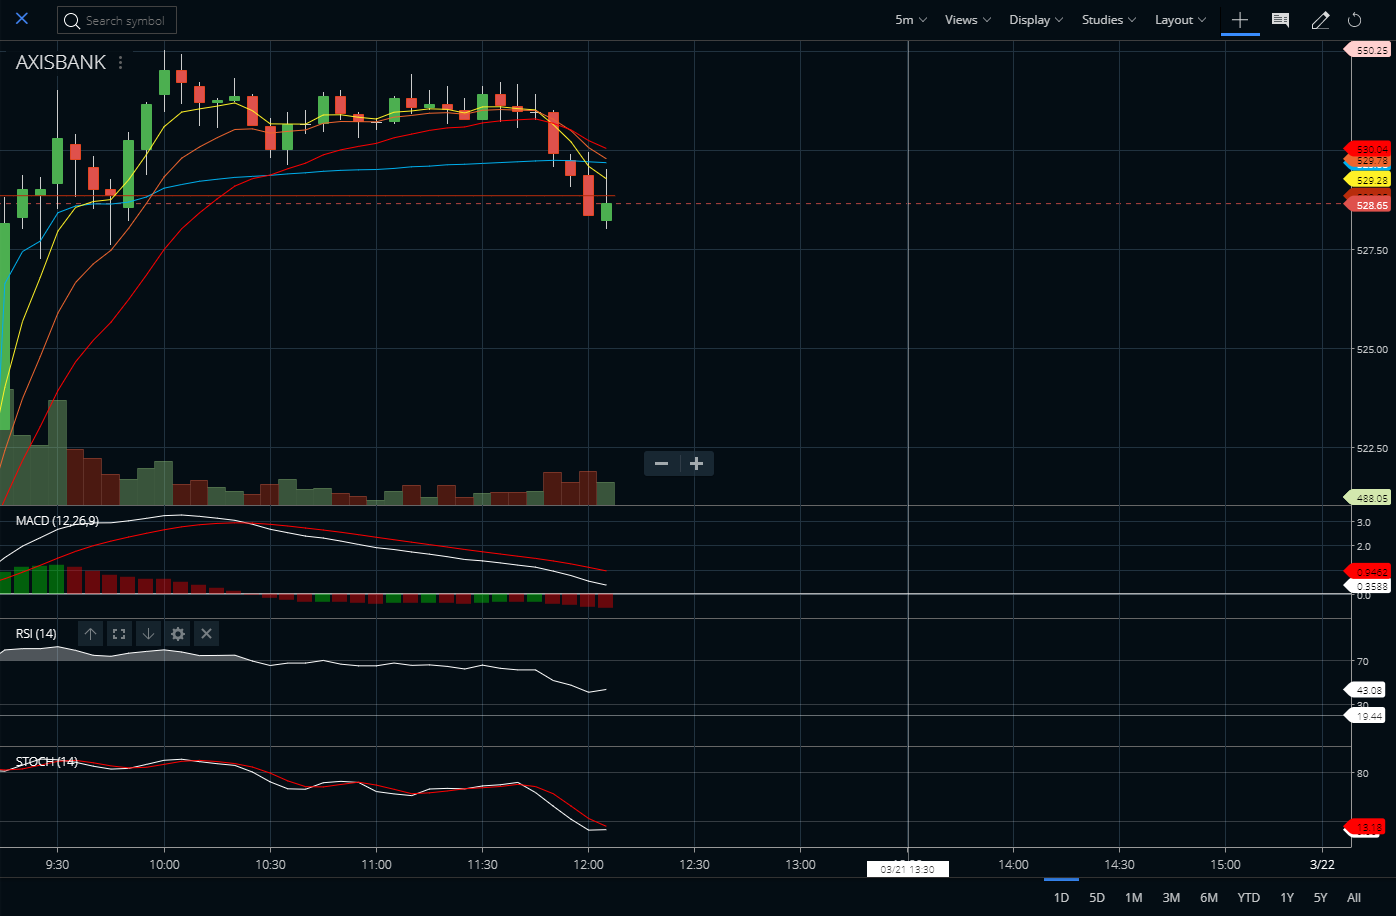
I use to trade with 5 mins candle charts resulting in mostly losses.
I recently noticed a strange thing… in 5 mins chart most of the indicators telling me to go long.
But in 15 mins chart, its the exact opposite, telling me to go short. :confused:

Here Axis Bank charts (5 mins and 15 mins)

What time chart should one follow for intraday?

1 Like


#JubliantFood is perfectly moving in channel. 2160, 2192 is possible by expiry of March series.


Keep #RelianceIndustries in Radar for #ShortTerm.

  1. Trading in channel since 5 months.
  2. It might bounce back from current level to 927, 955, 982.

For more such trade setup visit this link

1 Like


#Keep #ICICIBank in radar for #ShortTerm.

  1. Very close to trendline breakout on short side.
  2. It may touch 270, 262, 255, from current level.

For more such trade setup visit this link

All target reached in 3 trading session :joy:


#Keep #AsianPaints in radar for #ShortTerm

  1. Nicely moving in channel since 10 months except couple of false breakout on long side.
  2. It should bounce back from current level to 1140, 1165, 1200.

For more such trade setup visit this link

Keep #HCLTECH in radar for #ShortTerm

  1. Bullish Engulfing, Falling wedge on daily and Cup & Handle on weekly chart.
  2. Its likely to touch 985, 1025 and 1100 in 30 trading sessions.

For more such trade setup visit this link

1 Like

good analysis i trade it today and made good profit Thank you

1 Like

Very good :sunglasses:


Keep #UPL in radar for #ShortTerm

  1. It may touch 750, 785 and 830 in 30 trading sessions.

For more such trade setup visit this link

congrats! as much as you can see i’m new here (in fact, not sure if this is displayed anywhere), anyway, i thought that i could get some help by chatting with people on forum so since you made some profit i guess you know how all these things go and was wondering if you don’t mind if i would have some questions to ask? thanks!

Keep #Havells in radar for #ShortTerm

  1. Nicely moving between two trend line.
  2. Taking support near trend line
  3. It can touch 600 level in 70 trading sessions.

For more such trade setup visit this link

1 Like