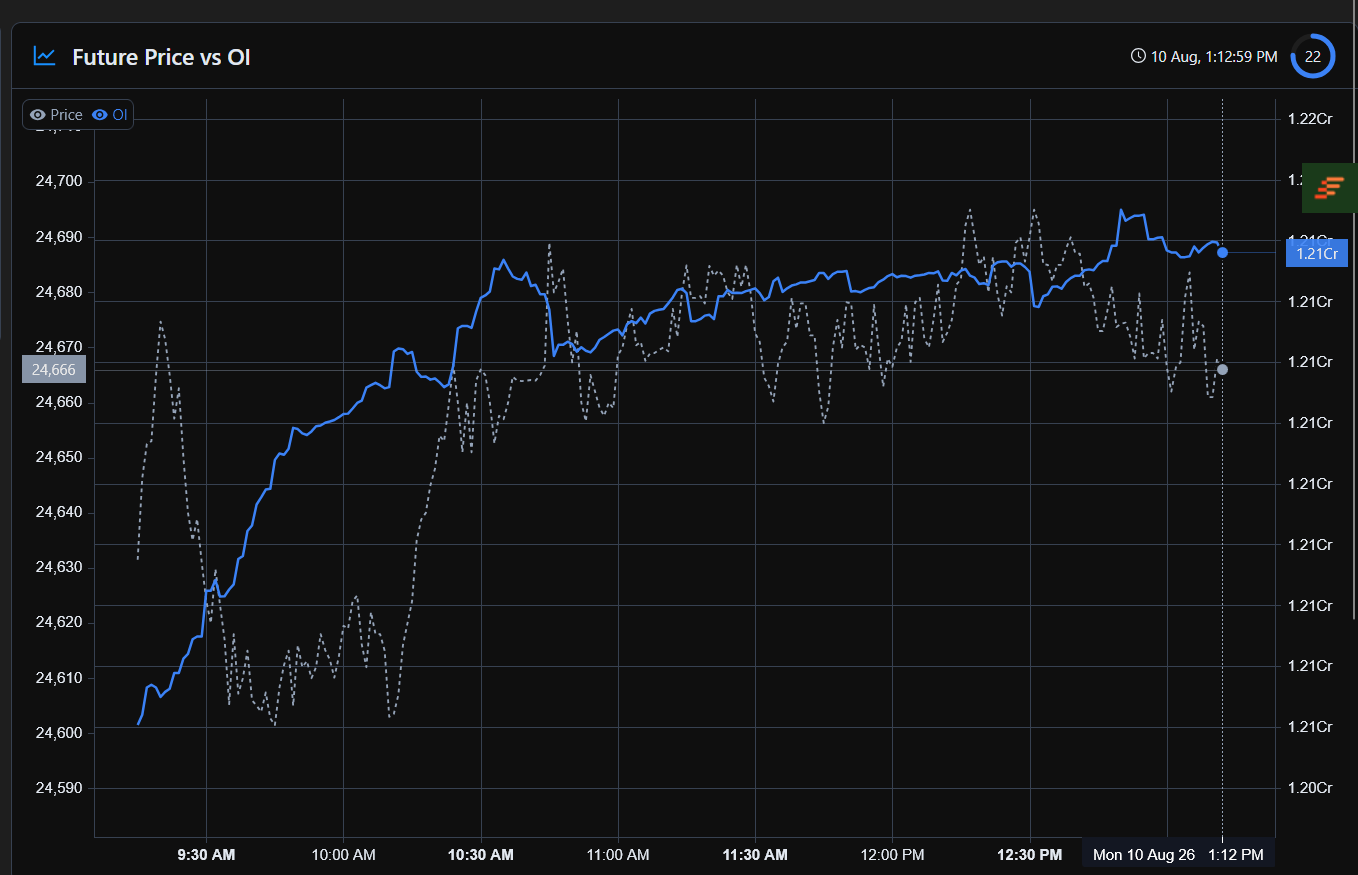
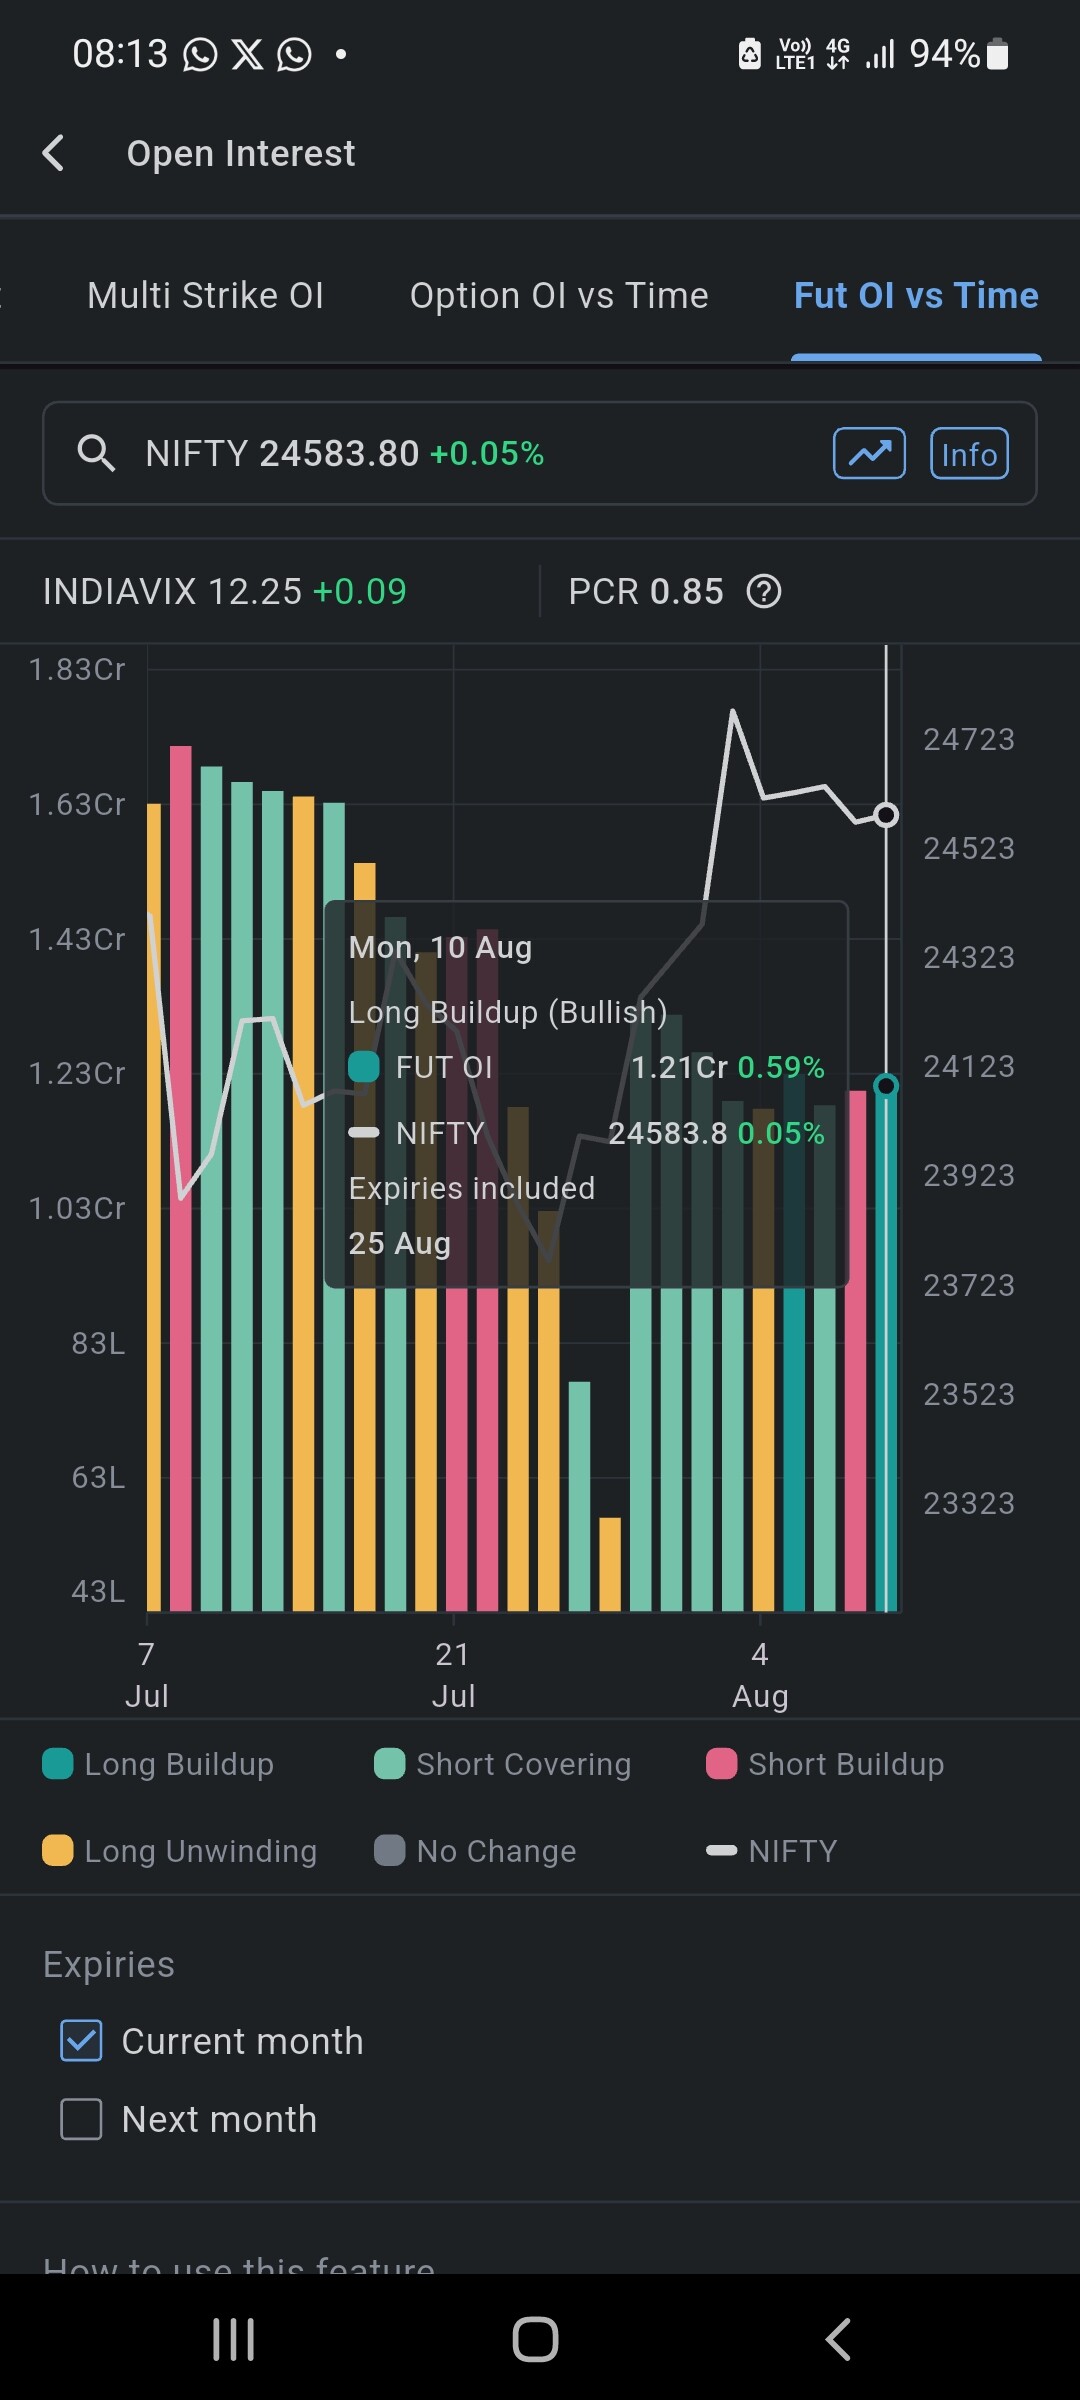
I am looking at option chain daily dsensibul various options data. I observed that Fut OI VS Time data on sensibul is the EOD data for past reading day.
When I searched on internet & exchanges data comparing I found that few brokers / platforms have those live data working in live market compared to zerodha sensibul EOD data.
Unnamed site was having those data directly highlighted in their option chain
So, now I have a question that if u guys r f&o traders then how u get to know if there is long buildup or short buildup like this w/o having to know how big players manipulate things in live market only from Option chain Data? An exception that sudden change in OI is easy to find out what’s gng on but if there is very slow oi change then how do u catch those things?
This shud not include ur AI made platforms or screener where the data is on ur screen directly😊
huh…
The idea that big players are actively manipulating the market to target your SL😭
sounds more like a conspiracy theory to me . And even if such manipulation really exists, how exactly are you supposed to detect or “get rid of” it using OI data?
I know my query is apart from live chains how an trader knows whether there is short buildup, long u winding without having it anywhere in live market?
See this it tells long buildup yesterday but in LIVE how u find out. Many platforms has ready made built up feature in their live option chain or separately.
Knowing sudden changes is very easy to find pit, but with slow & no clues not just depending on OI?
Mmm, fair point. I don’t see it as targeting our SL or as a conspiracy theory. Big players need large liquidity to execute size, and obvious SL areas can provide that liquidity. The focus isn’t on assuming manipulation, but on understanding how price behaves around obvious liquidity/SL zones and managing risk accordingly. The key is to identify those areas before the move, then use price action, OI, volume and other data together to decide the next course of action—not depend on OI alone.
Yes, I know Sensibull has live option-chain data. My question is slightly different — apart from simply having live data, how does a trader identify whether long buildup, short buildup, long unwinding or short covering is actually developing in LIVE market?
Sudden OI changes are relatively easy to spot, but what about a slow buildup where there is no obvious spike in OI? Many platforms provide a ready-made buildup indicator, but I’m trying to understand the underlying method — what combination of price, Futures OI, volume, VWAP, option OI/IV etc. should we track in real time to identify the developing position before EOD?
Yes, exactly — those are the standard definitions, and that’s clear from EOD data.
My question is about the LIVE part.
For example, if Price ↑ and OI ↑, we can classify it as long buildup. But in live market, how do we know whether that OI increase is actually fresh long creation rather than the result of position adjustments/rolls or other activity? And what if price and OI are changing slowly without a clear spike?
I’m trying to understand what additional live signals/confirmation, other data we should track — price structure, rate of OI change, volume, VWAP, futures basis, option-chain OI/IV, bid-ask/order flow, etc. — to identify the developing positioning early rather than simply label it after the move/EOD.
We don’t. This is just a educated interpretation of intentions of market players.
Just calculate the difference: If you’re looking at 2pm data, even if there is no clear spike, but price at 2pm is greater or significantly greater than open(9am) and OI follows, we assume light or significantly greater Long buildup
 . And even if such manipulation really exists, how exactly are you supposed to detect or “get rid of” it using OI data?