Could not get a very good example. Got a slight one here. (But I am observing this so many times)
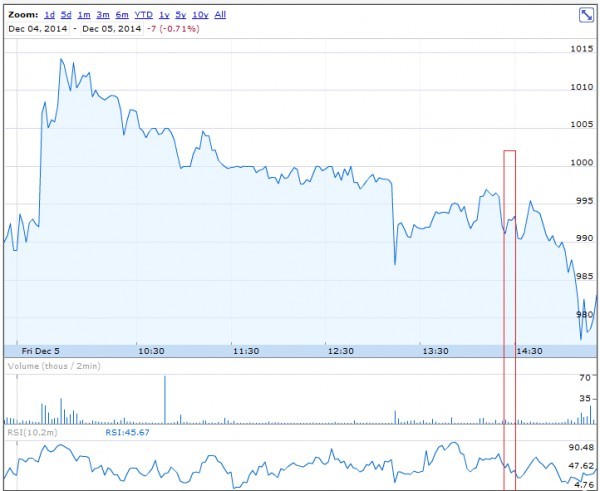
Graph of BHARATFORG on 05thDec2014
Could not get a very good example. Got a slight one here. (But I am observing this so many times)
Graph of BHARATFORG on 05thDec2014
Opposite behavior can be termed as Divergences. Divergences might lead to reversal from the current condition. Either one of the behavior would align itself with the other in the future. Now, for finding out which one would align back correctly, look for the direction of lagging indicators.
Attach the snapshot to discuss the specifics.
Update:Looking at the snapshot, the price increased from 991 to 993.65, the RSI value decreased from 47 to 45. Even though the price increased because of mismatch in supply/demand, the RSI was indicating that the momentum is failing. You can observe, after that particular instance, the price adjusting itself with RSI by falling to 990.6. After that, both price and RSI got aligned in the same direction and moved to 995.
Detailed research can be done at the website of stockcharts.com. Search for the keyword 'Divergences'.
Some more answers please!
I dont understand this divergence stuff explained by sdg. Sorry about that!
Did you say attaching the snapshot?
But where is it?
AG, u hv mentioned in ur query that sometimes u see divergence(when price decreases, RSI increases). Attach that particular snapshot to discuss it specifically.
Oh Ok. Hold on I will do that.
my answer is updated with comments on the snapshot.
That link was very helpful. Thanks sdg