Welcome to Beyond the Charts! A newsletter where we dive into fascinating charts from the world of finance and the economy, breaking down what’s happening in a way that’s easy to understand.
If you prefer watching video over reading, you can watch the episode here:
Mutual fund industry trends
In our first story, we’ll check out the latest numbers from AMFI and take a closer look at what’s happening in the mutual fund industry.
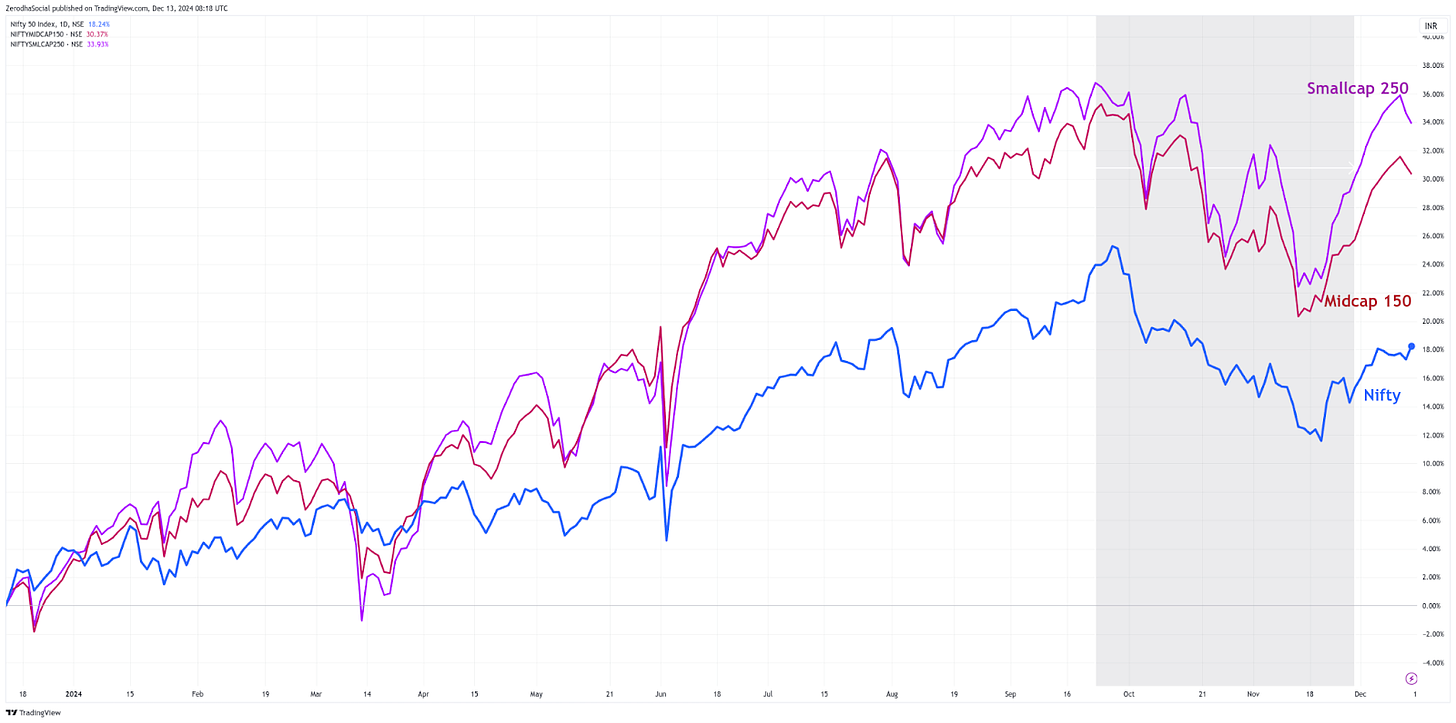
Lately, the Indian stock markets have had a tough time. In October and November, they dropped by over 6% as investors grew more concerned. Growth seems to be slowing, and many feel that stocks were getting too expensive. On top of that, foreign investors have been pulling their money out of Indian markets.
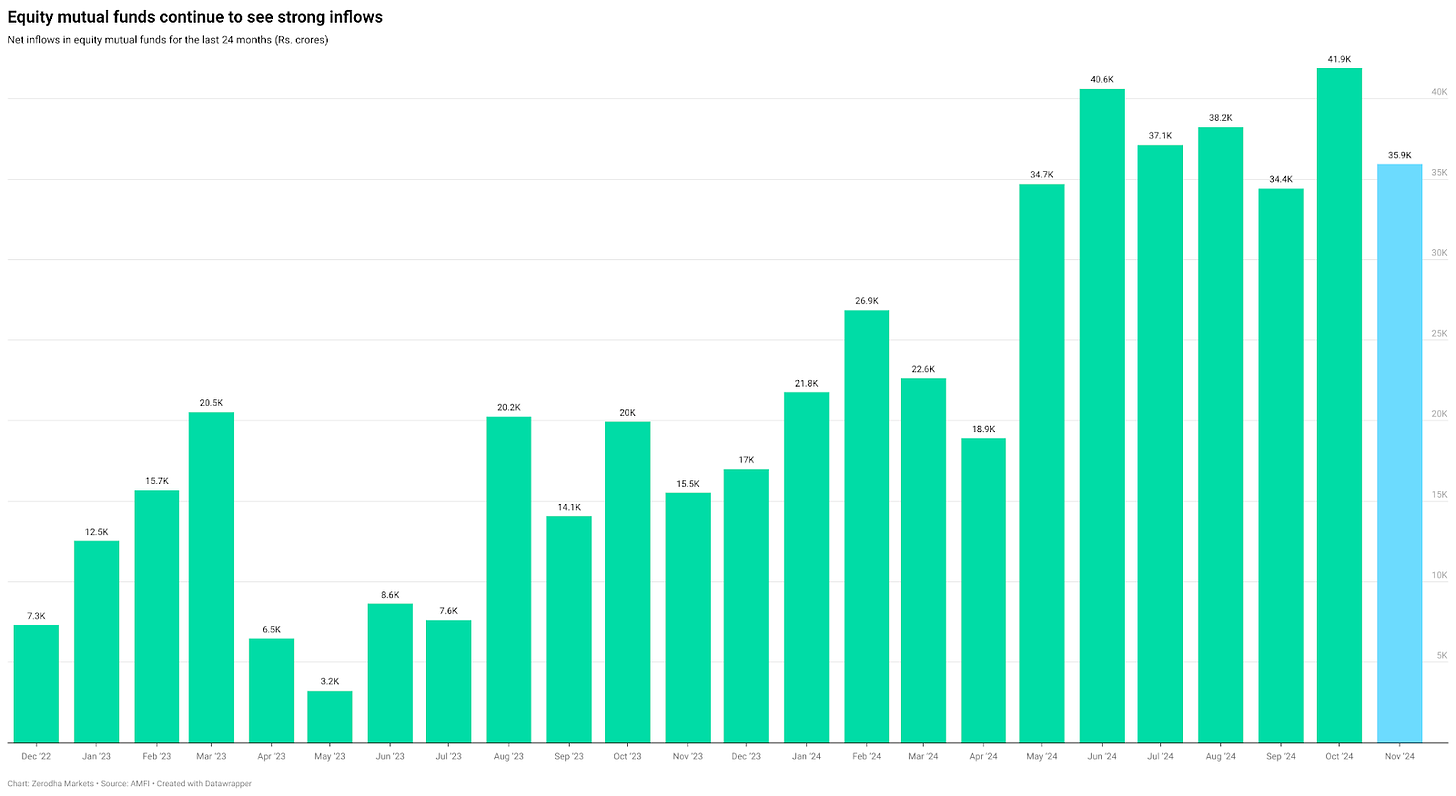
Even with the market downturn, Indian investors haven’t lost much confidence. The latest data from AMFI (Association of Mutual Funds in India) shows that equity mutual funds pulled in a solid ₹36,000 crore in November. That’s a bit lower than October, but still impressive—investments have been above ₹34,000 crore for eight months straight.
What’s even more interesting is that equity funds have seen positive inflows for 45 months in a row. In other words, for nearly four years, more money has been going into equity mutual funds than coming out.
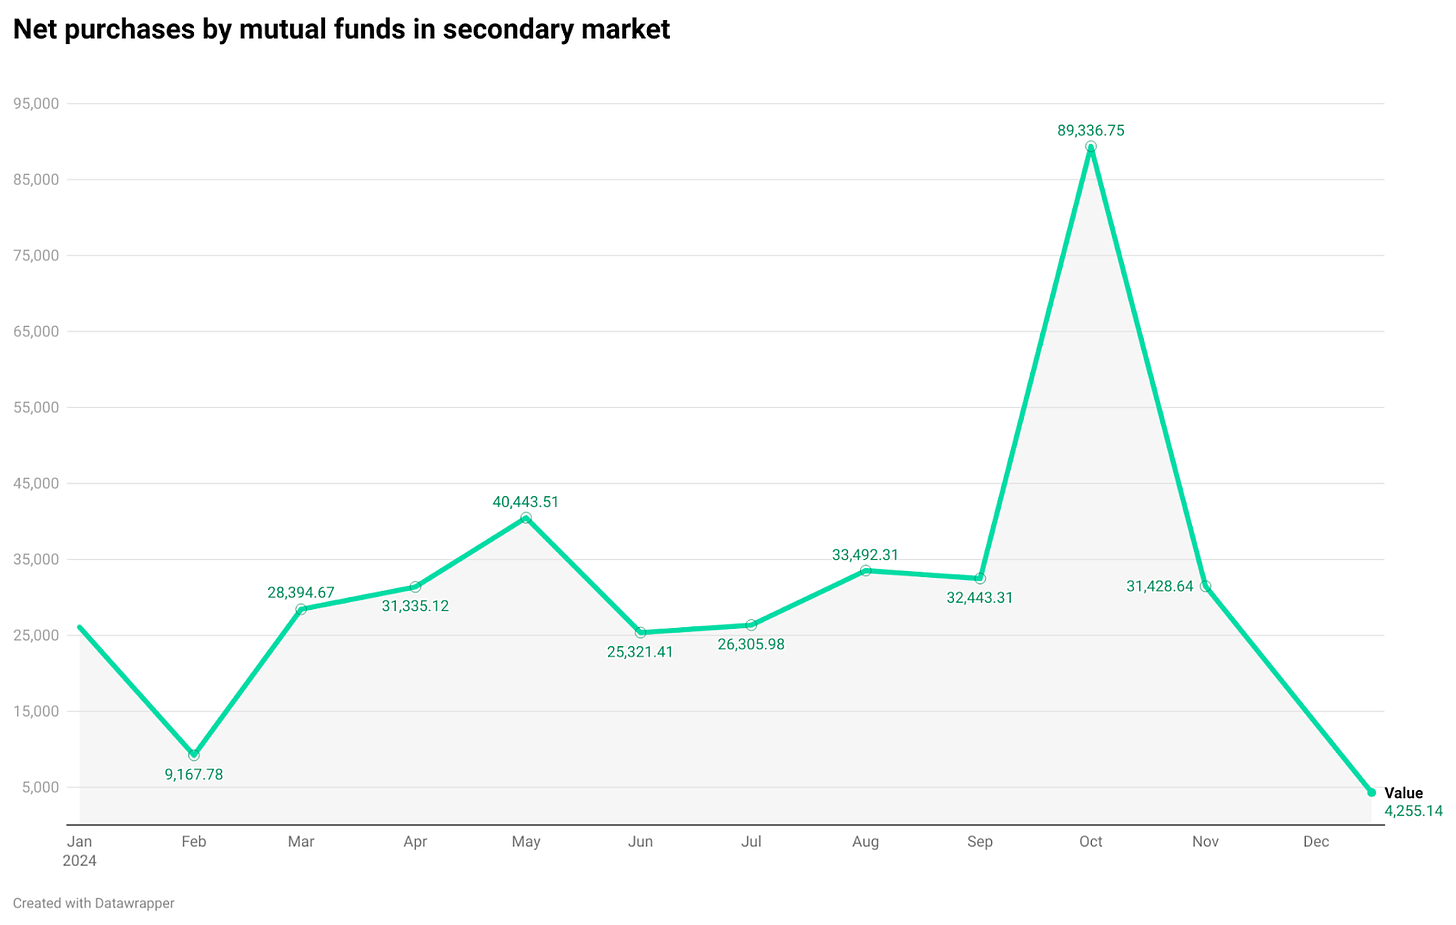
Even though money is flowing into mutual funds, mutual funds’ net buying in the stock market has dropped to its lowest point in 2024.
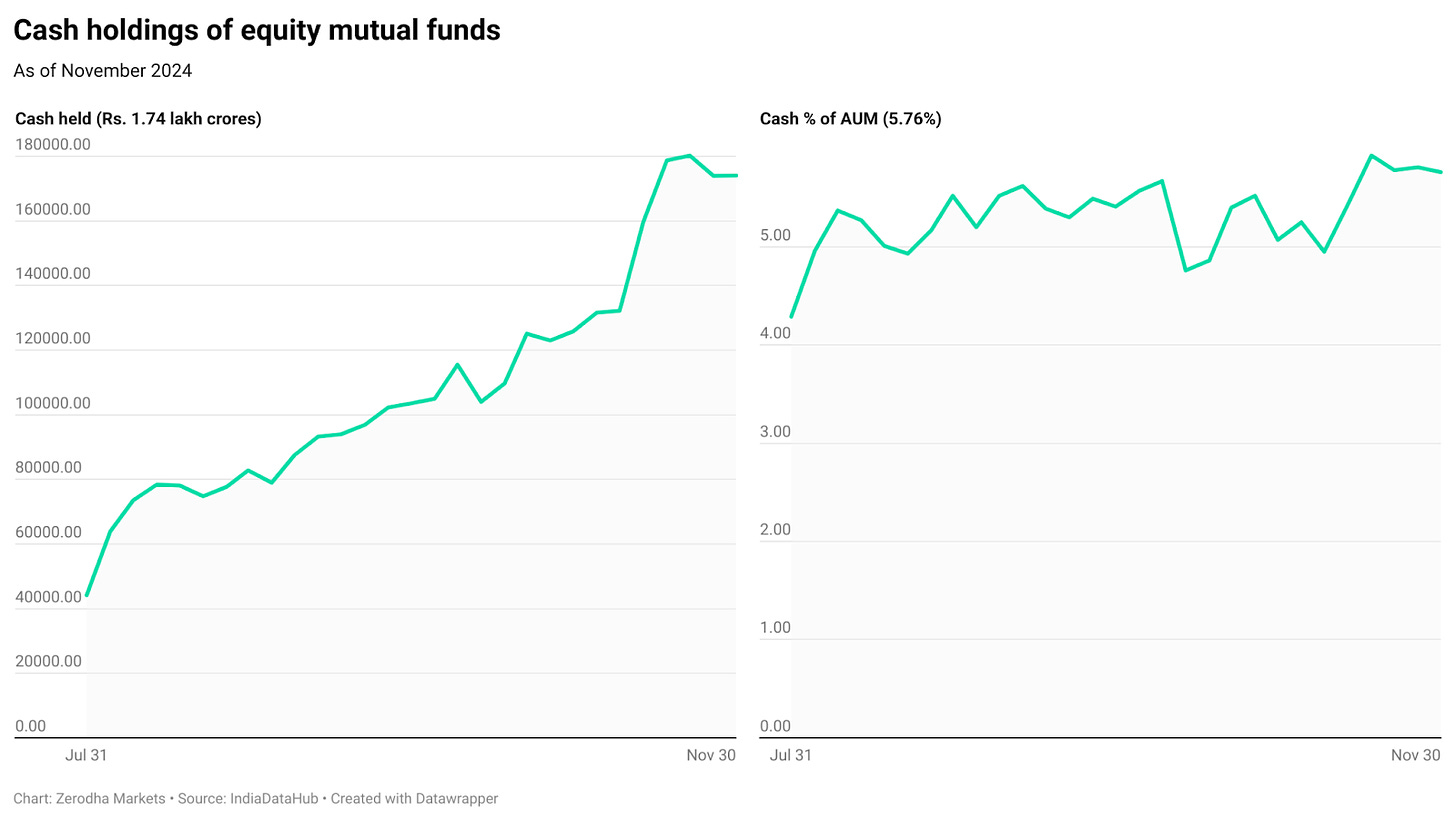
Equity mutual funds are holding more cash these days. As of November, they had about ₹1.74 lakh crore in cash, which makes up around 5.8% of their total equity assets. This is slightly lower than last month, likely because of the recent market drop, but overall, cash levels have stayed pretty steady.
Now, you might wonder—if mutual funds have all this cash, why don’t they just invest it and stop the market from falling? Well, it’s not that simple. Most mutual funds keep about 5% of their assets in cash for practical reasons. This cash acts as a buffer, helping them manage investor withdrawals without having to sell stocks at the wrong time. If they didn’t have this cushion, they might have to sell shares at lower prices, which could hurt performance.
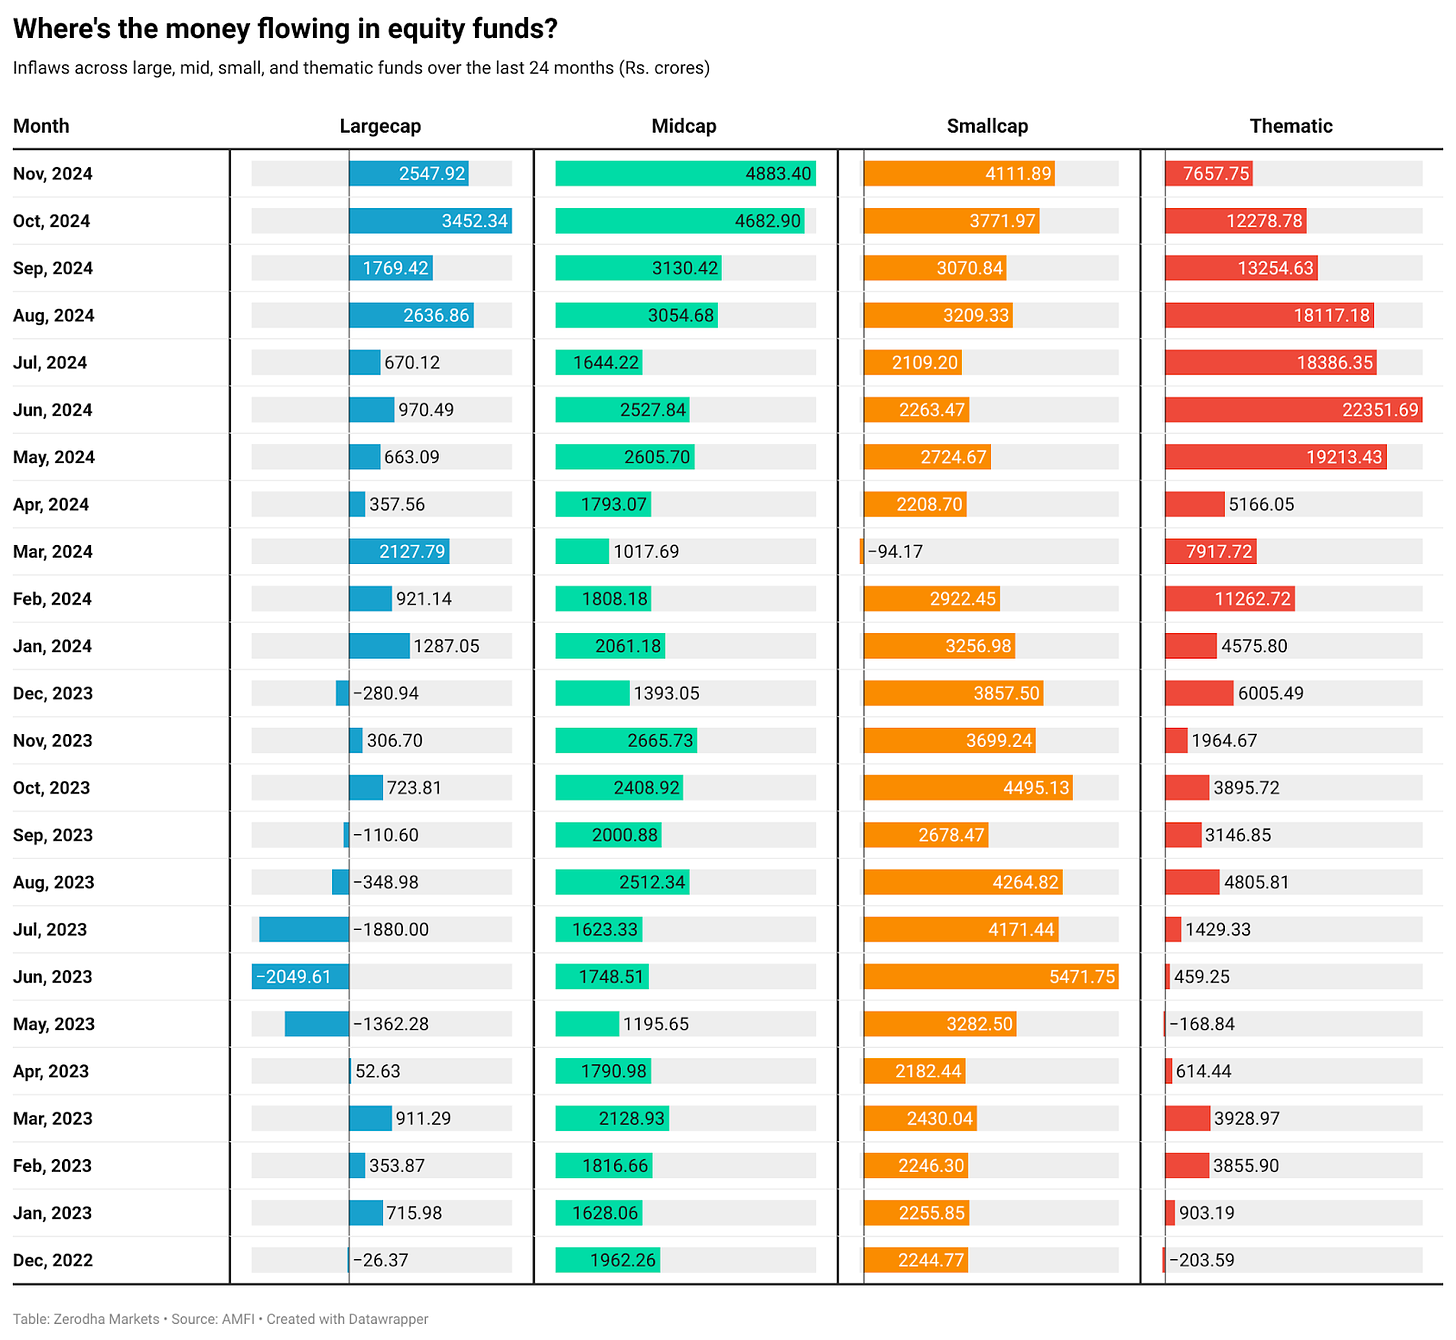
When we break it down by category, most of the new money flowing into equity funds is heading to two key areas:
- Thematic funds – Investors are going big on specialized funds that focus on specific sectors or themes. These could be funds that invest in auto companies, banks, or newer areas like green energy and infrastructure.
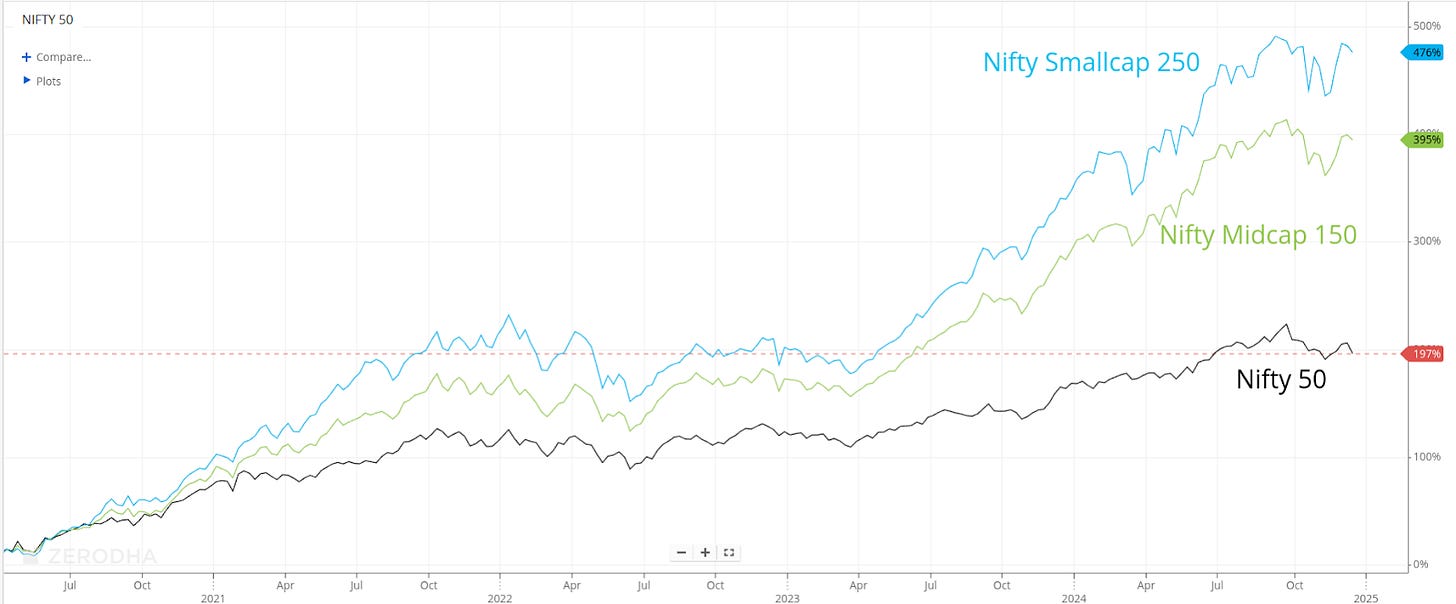
- Mid and small-cap funds – There’s strong interest here too. With mid and small-cap stocks seeing an incredible run since 2021, it’s no surprise that retail investors are still chasing performance.
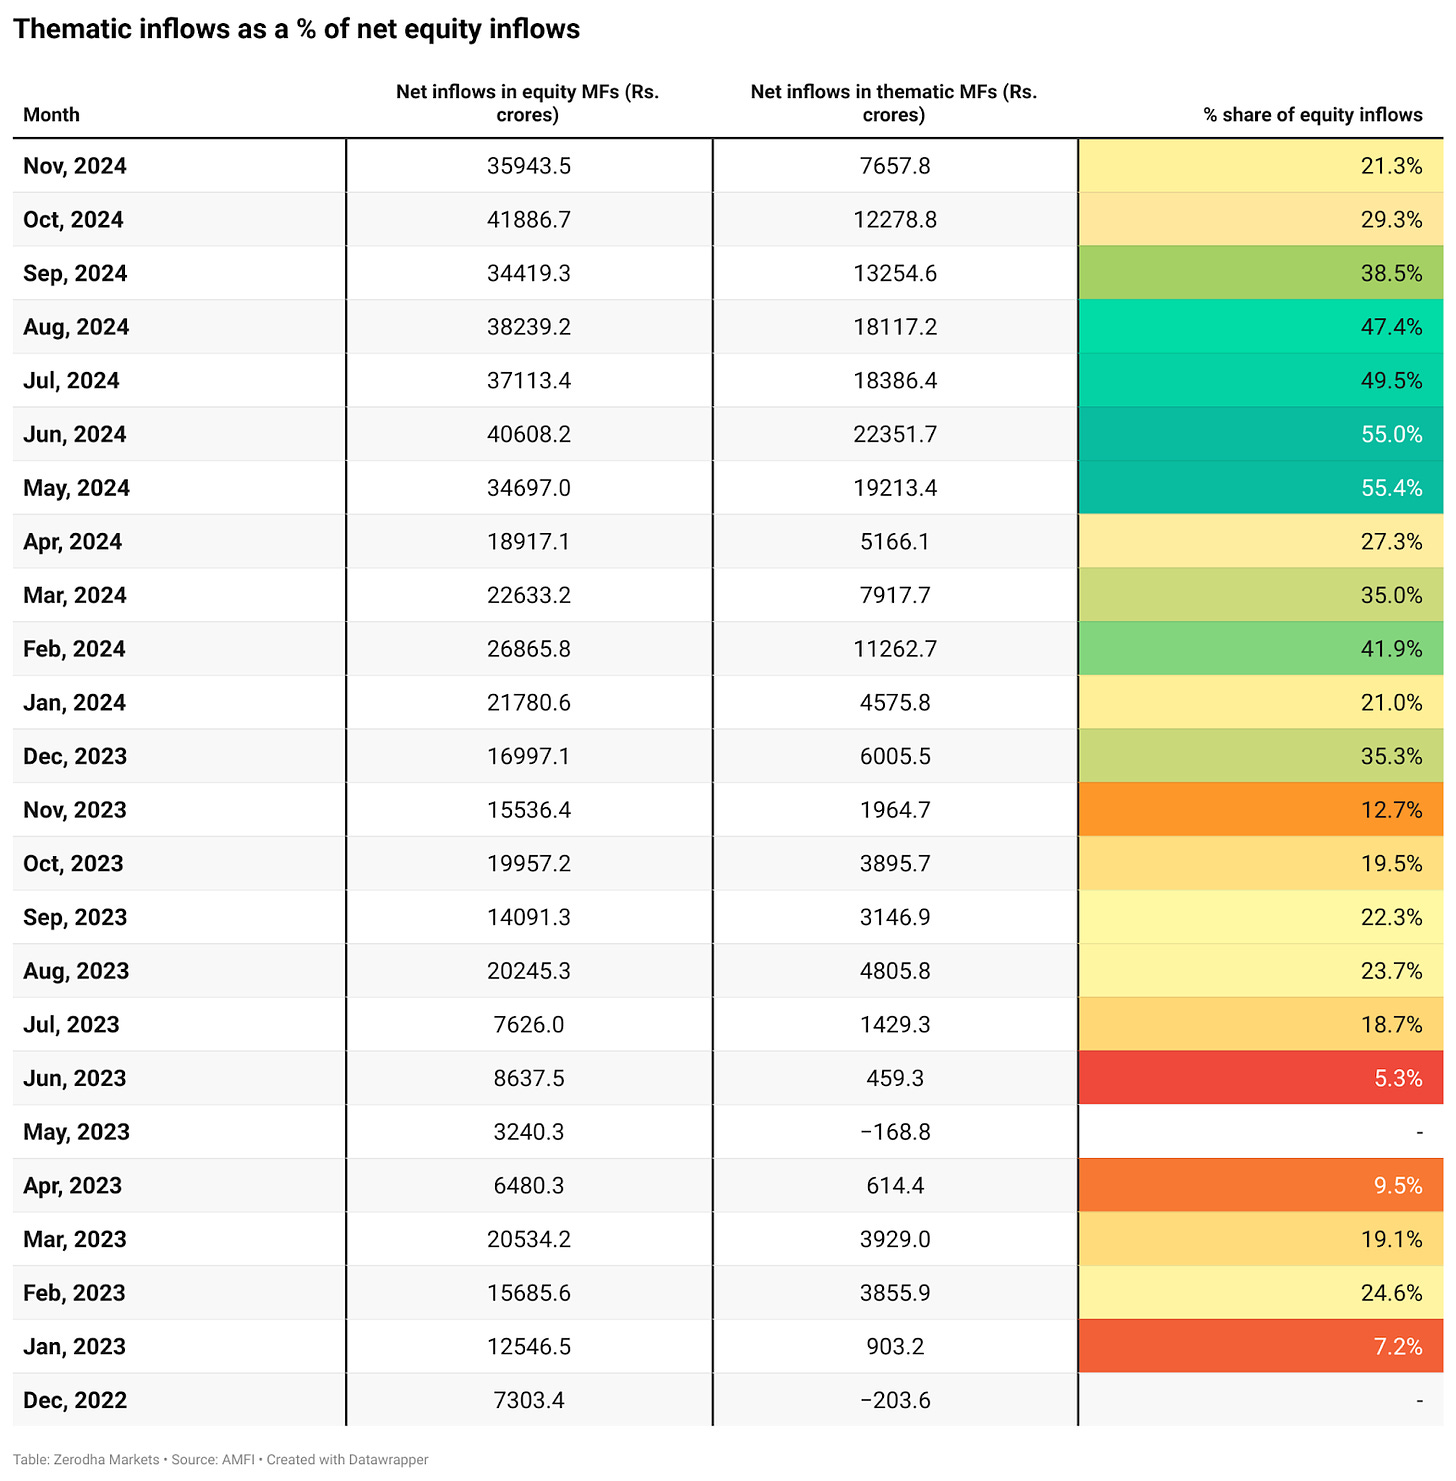
Thematic funds are having a big moment in 2024 as markets keep reaching new highs. These funds have brought in over ₹1.40 lakh crore by November, making up around 38% of all equity mutual fund inflows. That’s a huge shift from 2023 when most investors didn’t pay much attention to them.
When markets are booming, investors tend to feel more confident. Instead of sticking to broad, diversified funds, they’re more willing to take focused bets on specific sectors or themes.
Now, let’s talk about SIPs.
The SIP story this year is a mix of good and not-so-good news. On the bright side, monthly inflows are strong—₹25,300 crore came in, and total SIP investments for the year stand at ₹2.41 lakh crore. But there’s also a worrying sign.
The SIP stoppage ratio hit 79.12% in November. This means a lot of investors are either pausing or stopping their SIPs altogether. The uncertainty in the markets is probably to blame—new investors are more cautious, and some existing ones are hitting the brakes for now.
Source: Moneycontrol
Let’s talk about New Fund Offers, or NFOs.
Think of NFOs like IPOs, but for mutual funds. Just like companies raise money from the public through IPOs to list on the stock market, mutual fund companies (or AMCs) launch NFOs when they want to start a new fund. They gather money from investors through these offers and invest it according to the fund’s mandate.
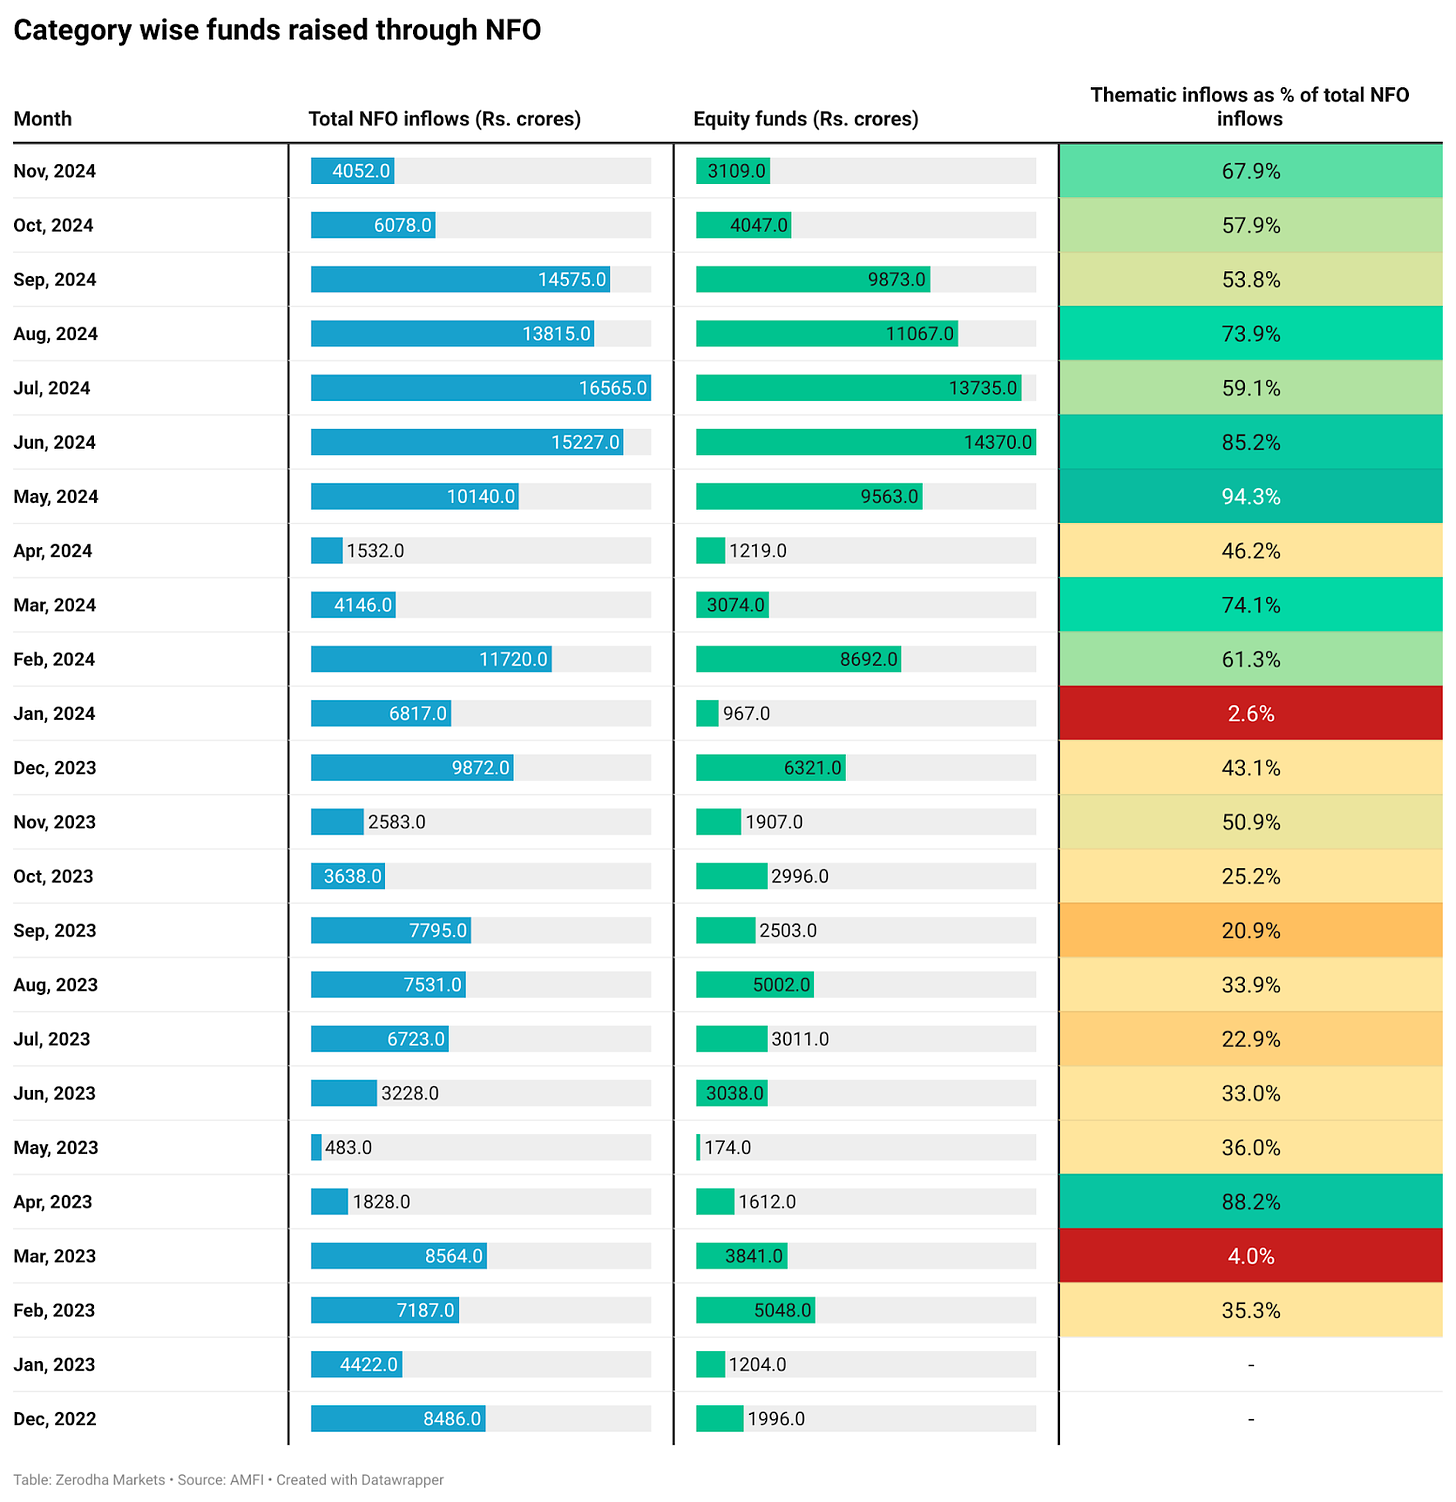
And, much like IPOs, NFOs tend to spike when markets are doing well. The numbers this year reflect that—AMCs have raised over ₹1 lakh crore through NFOs by November, averaging ₹10,000 crore a month. But as market sentiment cooled in the last two months, so did NFO launches.
Where’s all this money going? About 70% of NFO investments have flowed into equity-focused schemes.
This aligns with the broader trend we’re seeing in mutual fund inflows. Thematic funds are the clear winners, pulling in over 60% of equity NFO investments this year—double the amount from 2023.
Honestly, it’s not surprising. As we mentioned in a recent edition of Beyond the Charts on the rise of thematic funds—when something’s doing well, everyone wants a piece of it. Nobody wants to miss out on a trend that’s making money. And that’s exactly what’s happening with sectoral and thematic funds this year.
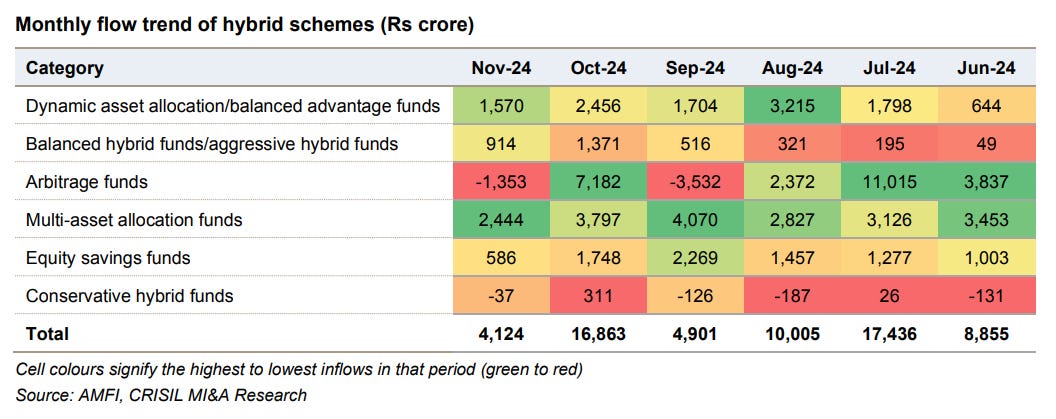
Let’s take a look at how debt and hybrid funds performed in November. While they still saw positive inflows, the numbers dropped sharply compared to October—debt fund inflows fell by over 90%, and hybrid funds saw a decline of more than 75%.
Zooming out to 2024, most fund categories have consistently attracted investments, except for those investing overseas. These funds are limited by the RBI’s $7 billion (around ₹59,400 crore) cap on mutual funds investing abroad. This restriction has kept a lid on how much these funds can accept from investors.
Now, let’s break down where the money is flowing within debt and hybrid funds.
In November, debt fund data revealed an interesting trend. About 57% of all inflows went into short-term funds, especially low-duration and ultra-short-duration funds.
This makes sense given the current market environment. With interest rates being unpredictable, many investors prefer shorter-duration debt funds. These funds are less affected by rate changes and offer better liquidity, making them a safer bet when the future of interest rates isn’t clear.
Source: AMFI
On the hybrid side, multi-asset allocation funds continued to attract solid inflows. These funds invest across different asset classes—like stocks, bonds, and gold—giving investors a mix that helps balance risk and returns.
Source: AMFI
At the industry level, total assets under management (AUM) grew to ₹68 lakh crore, marking a 1.2% increase despite the market downturn. Here’s how the money is distributed across different types of funds:
- Equity funds lead the way, holding ₹30.4 lakh crore. Their share of total assets has grown noticeably—from 55% last November to 59.7% now. This reflects the growing interest in stock market investments.
- Debt funds manage ₹16.9 lakh crore, but their share has dropped from 18.5% to 14.8% over the past year. This decline could be due to investors shifting away from fixed-income options, possibly attracted by rising bank FD rates.
- The remaining assets are split between other schemes—like index funds and gold ETFs—at ₹11.3 lakh crore, and hybrid funds at ₹8.8 lakh crore.
Source: AMFI
Source: AMFI
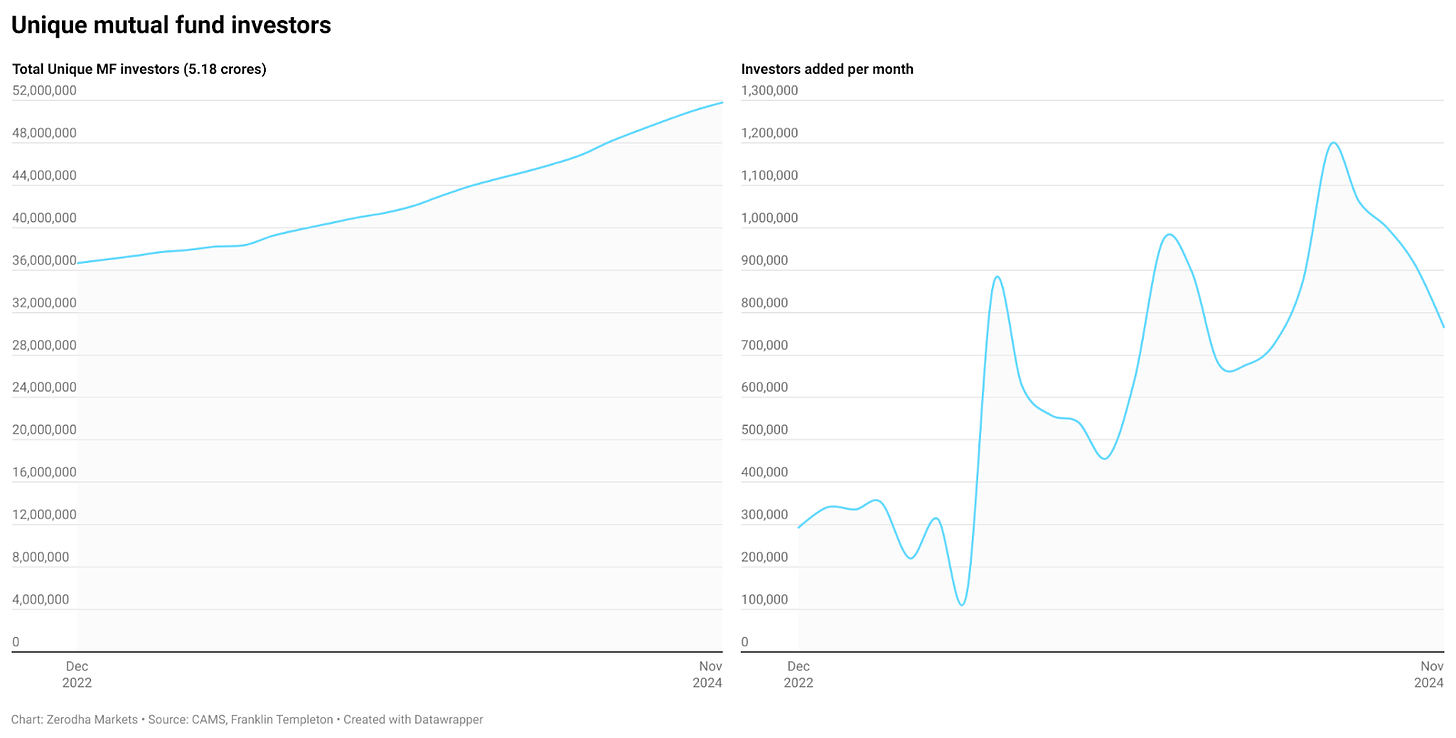
The mutual fund industry keeps growing its investor base, now serving over 5.18 crore unique investors. However, the pace of new investors joining each month has slowed—from a peak of 12 lakh in July to about 7.8 lakh in November.
Even with this slowdown, the growth over the past year has been remarkable. Over 1 crore new investors joined in just 12 months—double the number compared to the same period last year.
Where is the money coming from?
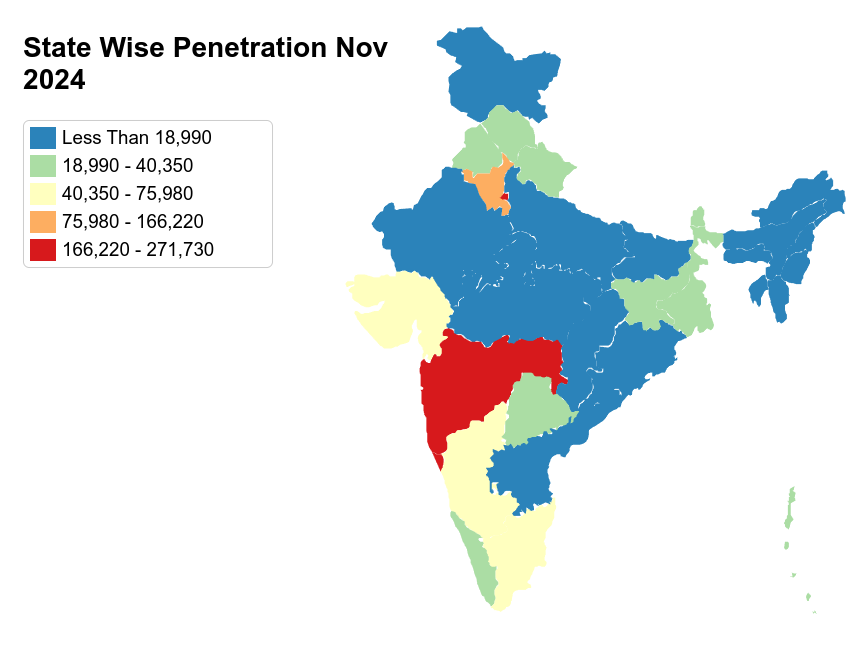
Three states—Maharashtra, Delhi, and Gujarat—account for 56% of the industry’s total assets under management (AUM). The top 8 states make up over 80%. AMFI data shows how mutual fund penetration varies by state, often reflecting their per-capita income and GDP. Beyond the top 5 states, mutual fund adoption is still relatively low.
Source: AMFI
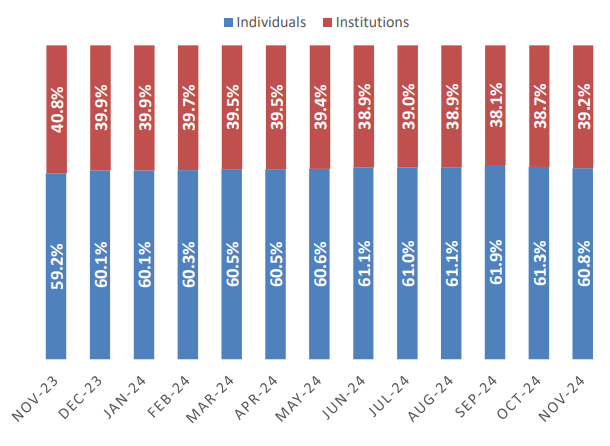
Individual investors—which includes retail investors and high-net-worth individuals—hold the lion’s share, about 61% of all mutual fund assets. This share has been steadily rising over time, while institutional investors (like corporates, banks, and foreign investors) hold the rest.
Source: AMFI
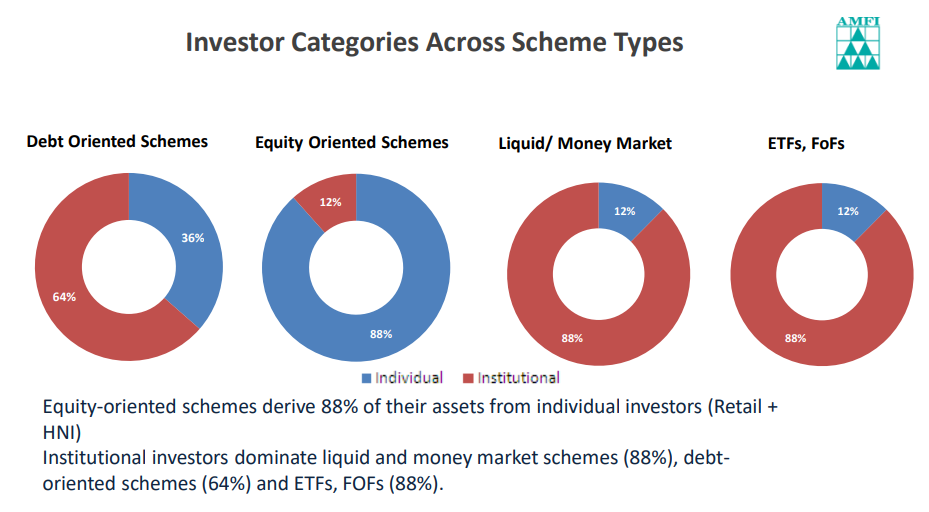
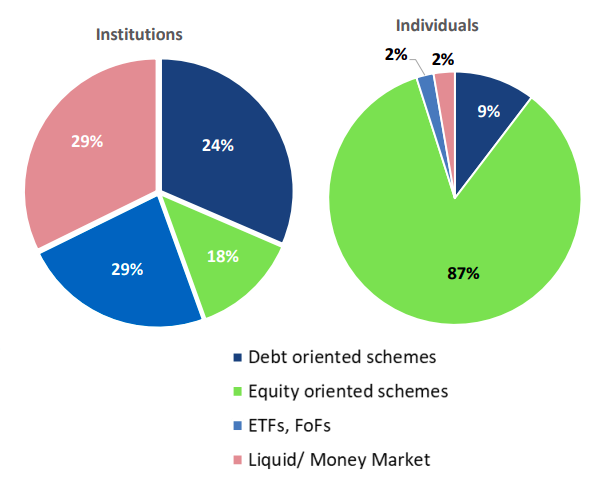
Individuals overwhelmingly prefer equity mutual funds, holding 88% of all equity fund assets. In fact, 87% of the money that individuals invest goes into equity schemes.
Institutions dominate debt funds, liquid funds, and money market funds. They also control 88% of ETF investments, driven largely by the EPFO (Employee Provident Fund Organisation), which invests heavily in ETFs tracking indices like Nifty and Sensex.
This difference comes down to the following things:
Individuals typically invest for long-term goals—like retirement or saving for their kids’ education. They’re willing to take more risk in hopes of higher returns since they have time on their side.
Institutions, on the other hand, need liquidity. Companies park money in debt and liquid funds to manage short-term cash flow—for payroll, inventory, or operational needs. They can’t afford to risk this cash in volatile markets.
Source: AMFI
Source: AMFI
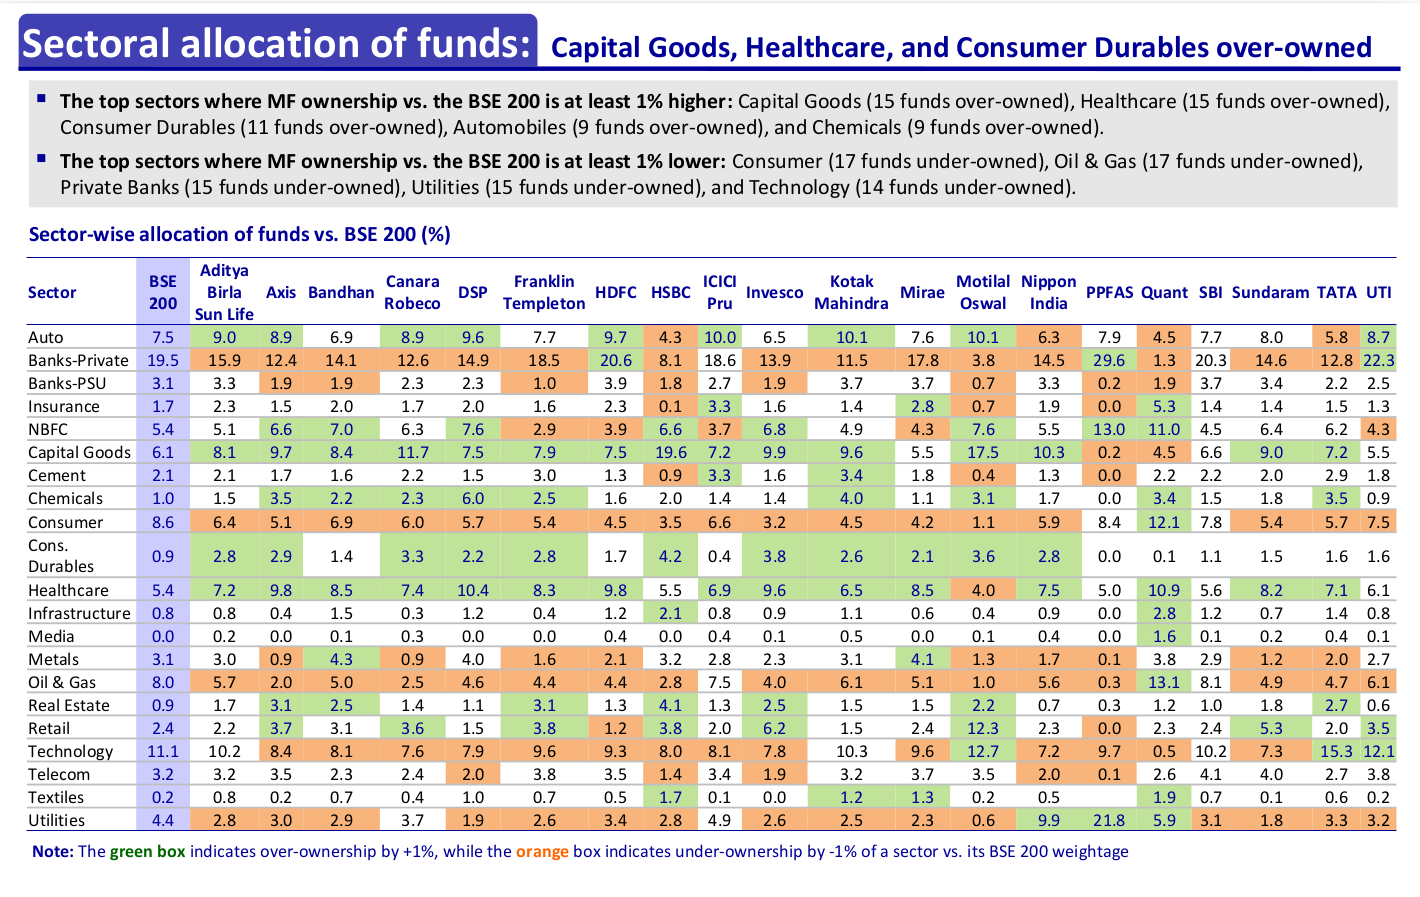
A new report from Motilal Oswal highlights some interesting shifts in how mutual funds are investing compared to the BSE 200 index. Fund managers are showing a clear preference for manufacturing and healthcare, while pulling back from tech and banking.
Capital goods is drawing a lot of attention—15 fund managers are investing more in this sector than the index suggests. Healthcare is just as popular, with 15 funds also betting big.
On the flip side, fund managers seem to be cautious about tech stocks. Even though tech makes up 11.1% of the benchmark, 14 funds are underweight in this sector. A similar pattern is seen with private banks and oil & gas—15 funds are cutting back on banking exposure, and 17 are steering clear of oil & gas.
The takeaway? Fund managers seem to be backing India’s growing manufacturing push while staying cautious about sectors tied to global trends or seen as overpriced.
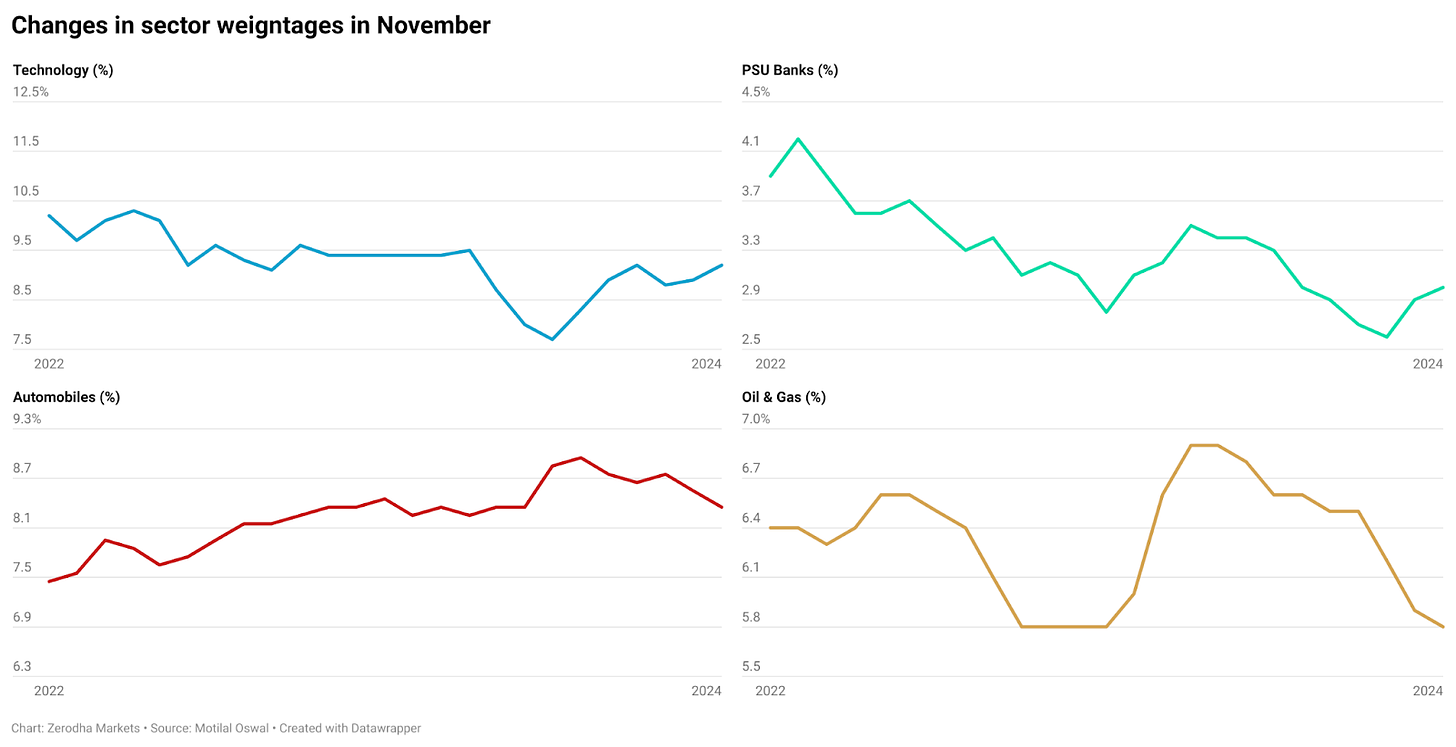
At the broader level, tech stocks are making a comeback. Their weight in mutual fund portfolios has risen for two straight months, reaching 9.2%. PSU banks are also seeing more love, with their share climbing to 3%—bouncing back after a dip in September.
Some sectors, however, are losing favor. The auto sector has dropped from a high of 8.9% in June to 8.3%. The oil & gas sector is sliding even further, with its weight shrinking for eight straight months, now down to 5.7%.
In November, there weren’t any major shake-ups in sector holdings. Private banks remain the top sector for mutual funds, followed by tech, auto, and capital goods.
Inflation and commodity prices
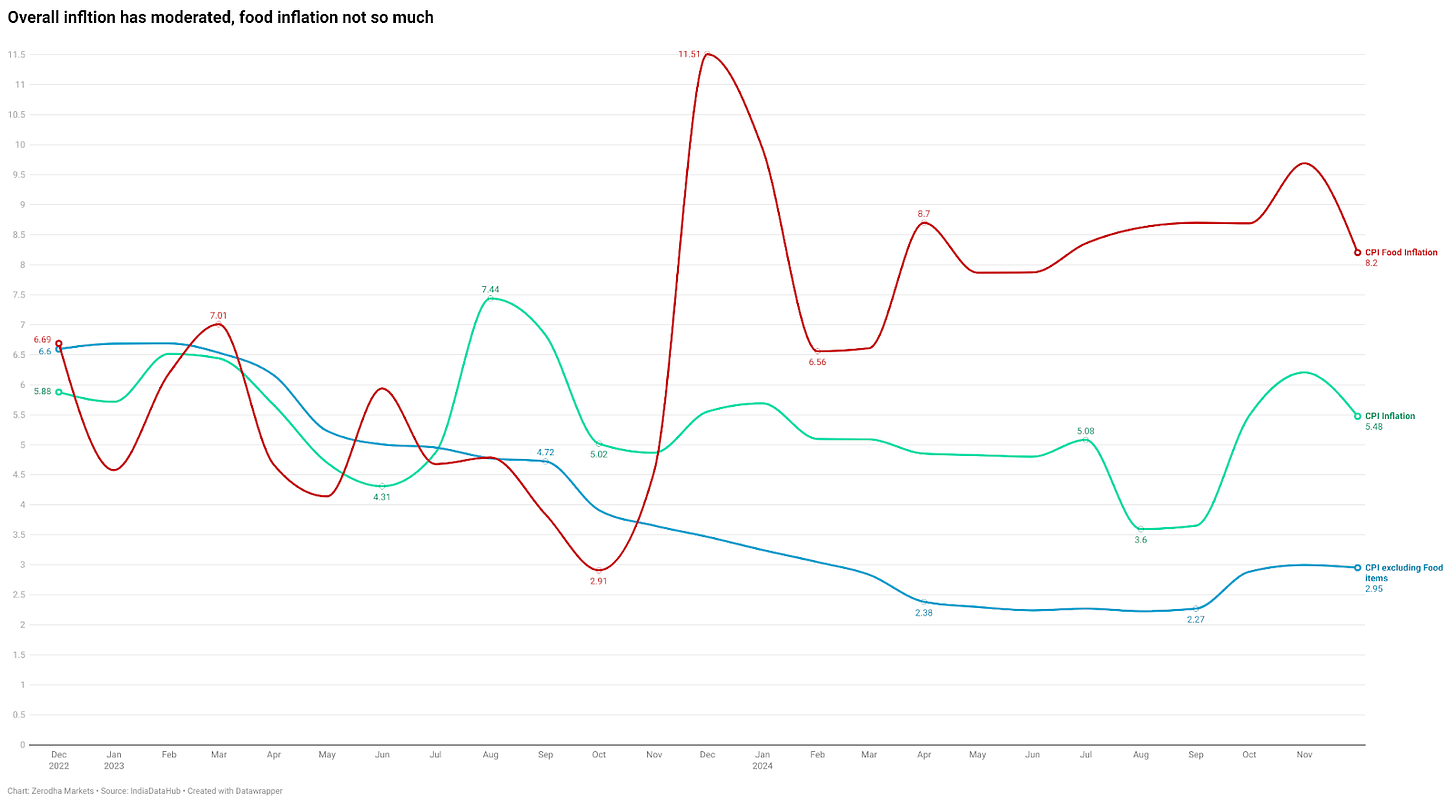
November’s inflation numbers bring some relief after two months of rising prices. Inflation dropped from 6.2% in October to 5.5% in November.
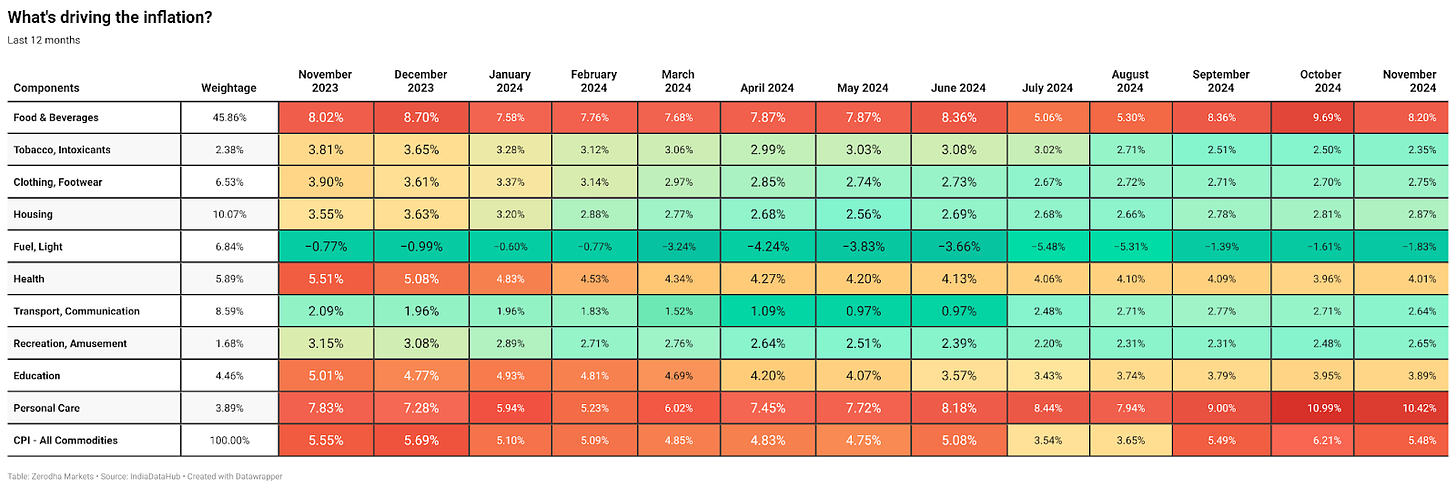
The recent surge in inflation has mainly been driven by higher food prices. But if we set food aside, prices in other categories have actually been coming down. This shows that everyday goods and services (excluding food) are seeing more stable prices.
Rising food prices are a big concern because they affect everyone, but hit poorer households the hardest. For families living on tight budgets, even small price increases can make a noticeable difference.
When food eats up a big chunk of a family’s income—especially in lower-income households—it forces tough choices. Nutritious but costly foods may be replaced with cheaper alternatives, or portion sizes may shrink. Unlike luxury purchases, food isn’t something people can cut out.
A lot of the spike in food prices can be traced back to bad weather—heatwaves, unexpected rains, and uneven monsoons. These factors have impacted key crops like vegetables, fruits, pulses, and cereals, pushing prices up.
Looking at food prices over the past couple of years, some clear patterns stand out:
- Vegetables (especially tomatoes and onions) – Prices have been volatile, with sharp spikes.
- Pulses and cereals – These household staples are steadily getting more expensive, increasing the cost of everyday meals.
- Edible oils – Groundnut oil has stayed relatively stable, but sunflower and mustard oil prices are climbing again after some relief earlier.
- Milk and sugar – Prices have mostly stayed steady.
- Tea – Prices have been fluctuating.
Consumer confidence
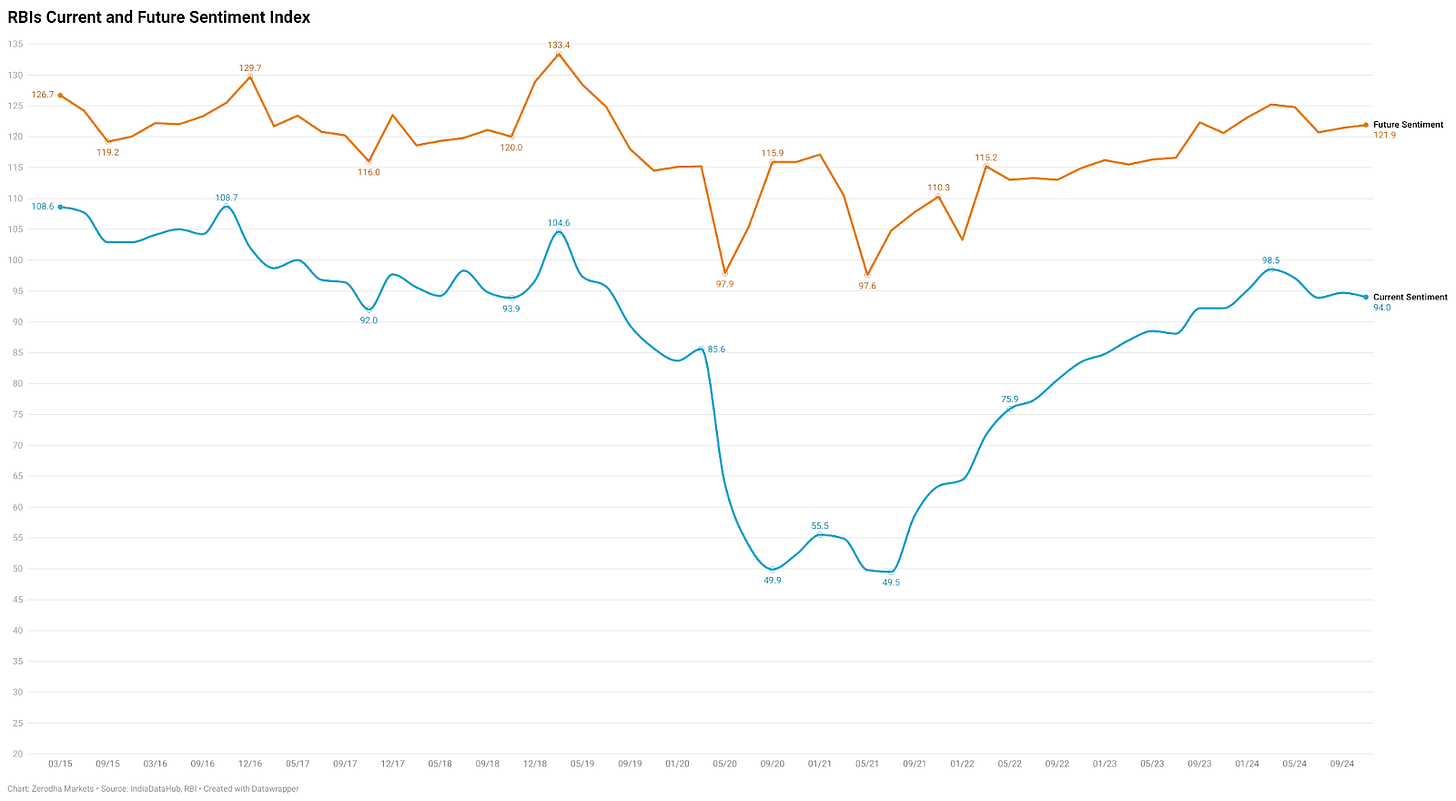
The Reserve Bank of India (RBI) conducts a consumer confidence survey every two months to get a sense of how Indian households feel about the economy. The latest survey from November 2024 gives us a snapshot of people’s thoughts on their income, job prospects, inflation, and spending habits.
Right now, confidence has dipped a little. The Current Situation Index (CSI) fell from 94.7 in September to 94.0 in November. This suggests that fewer people feel things like jobs, income, and the overall economy have improved compared to last year.
But when asked about the future, the mood shifts. The Future Expectations Index (FEI) actually ticked up from 121.4 to 121.9. Despite current worries, Indians seem optimistic about what’s ahead. They expect more job opportunities, higher incomes, and better spending power in the coming year.
The RBI survey gives us a glimpse into how people feel about jobs, inflation, income, and spending. Let’s break it down:
Jobs
- Now: Fewer people feel job opportunities have improved, with the net response dipping to -7.8.
- Future: There’s optimism ahead—people expect job openings to grow, with the net response for future opportunities rising to 28.1.
Inflation
- Inflation remains a big concern. 94% of households say prices have gone up in the past year.
- Sadly, relief isn’t in sight. The future outlook is still negative at -73.8, meaning most expect prices to keep climbing.
Income
- Right now, people feel their incomes haven’t changed much.
- But the future looks promising—56% of households believe their income will increase in the next year.
Source: RBI
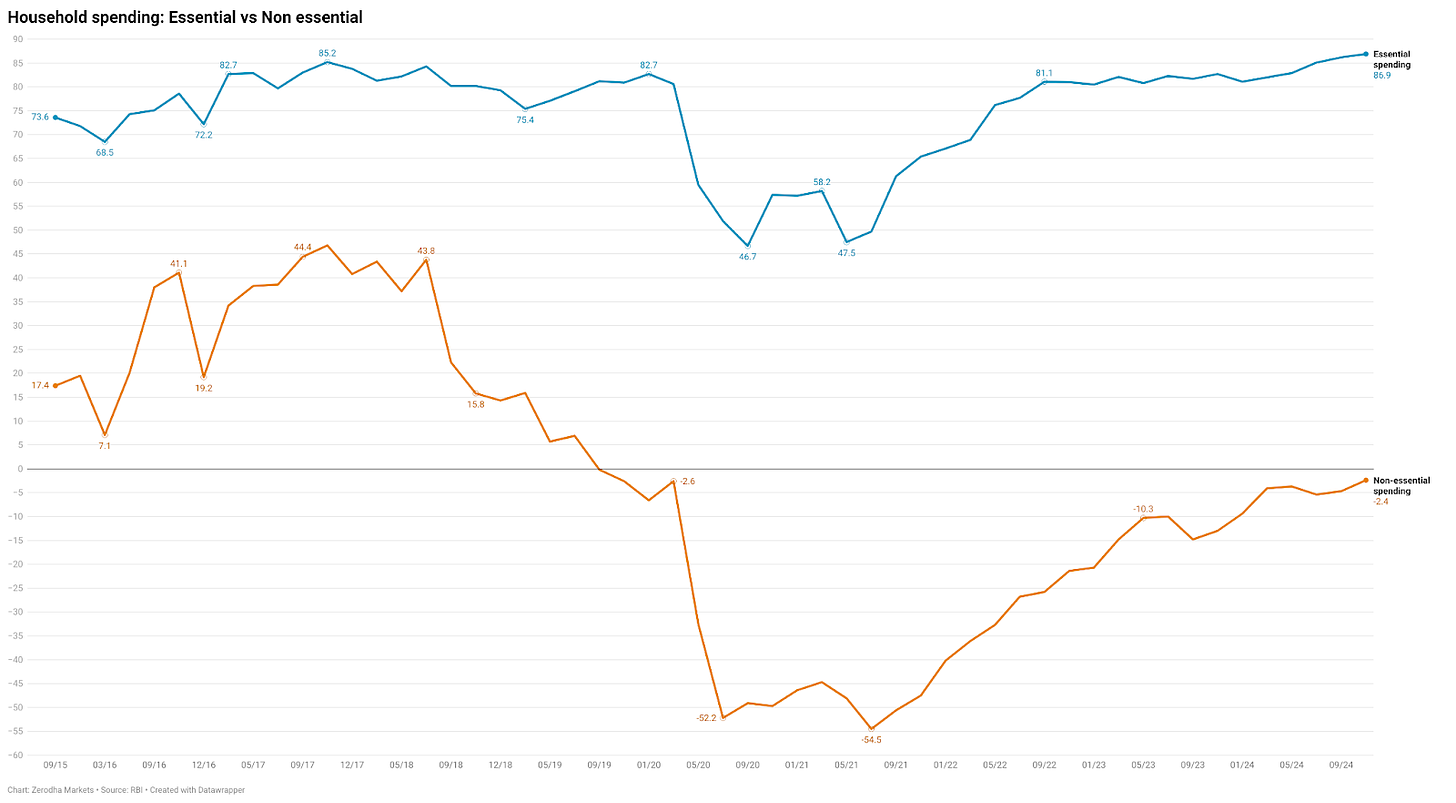
Coming to spending, a large majority—80.9% of households—say they’re spending more on essentials than they did last year. This isn’t surprising given the food inflation we talked about earlier, with rising prices for basics like vegetables, pulses, and cereals.
What’s interesting, though, is that non-essential spending has also picked up slightly. Despite higher costs for everyday items, many households still have some room for discretionary purchases. This shows that while inflation is squeezing budgets, it hasn’t completely stopped people from spending on other things.
That’s it from us today. Do share this with your friends to spread the word.
Also, if you have any feedback, do let us know in the comments.


