Where can I get a chart which shows % of stocks above or below the 50-day moving average (stocks in Nifty50 or similar Indian index)?
1 Like
Hi @mknits,
Are you looking for a way to find a list of stocks that are above their 50 DMA (i.e screener) or just a charting platform that shows how higher/lower the current price of a stock is with respect to its current price?
Either way, I think you will find Chartink website useful because it provides both scanning and charting features.
Cheers!
Neha (www.VRDNation.com)
@Neha, I’m not looking for a “list”. I’m looking for percentage of such stocks among an index which are above 50 day moving average.
Take this example, I am looking for the same in Indian context: http://stockcharts.com/h-sc/ui?s=%24SPXA50R
Sorry, but haven’t see it on any of the websites I know. However, if you happen to have Amibroker, it can be coded easily.
I like how you are going for the macro picture - especially important in the current market when the texture seems to be changing.
Hope the gurus on the forum could help you out.
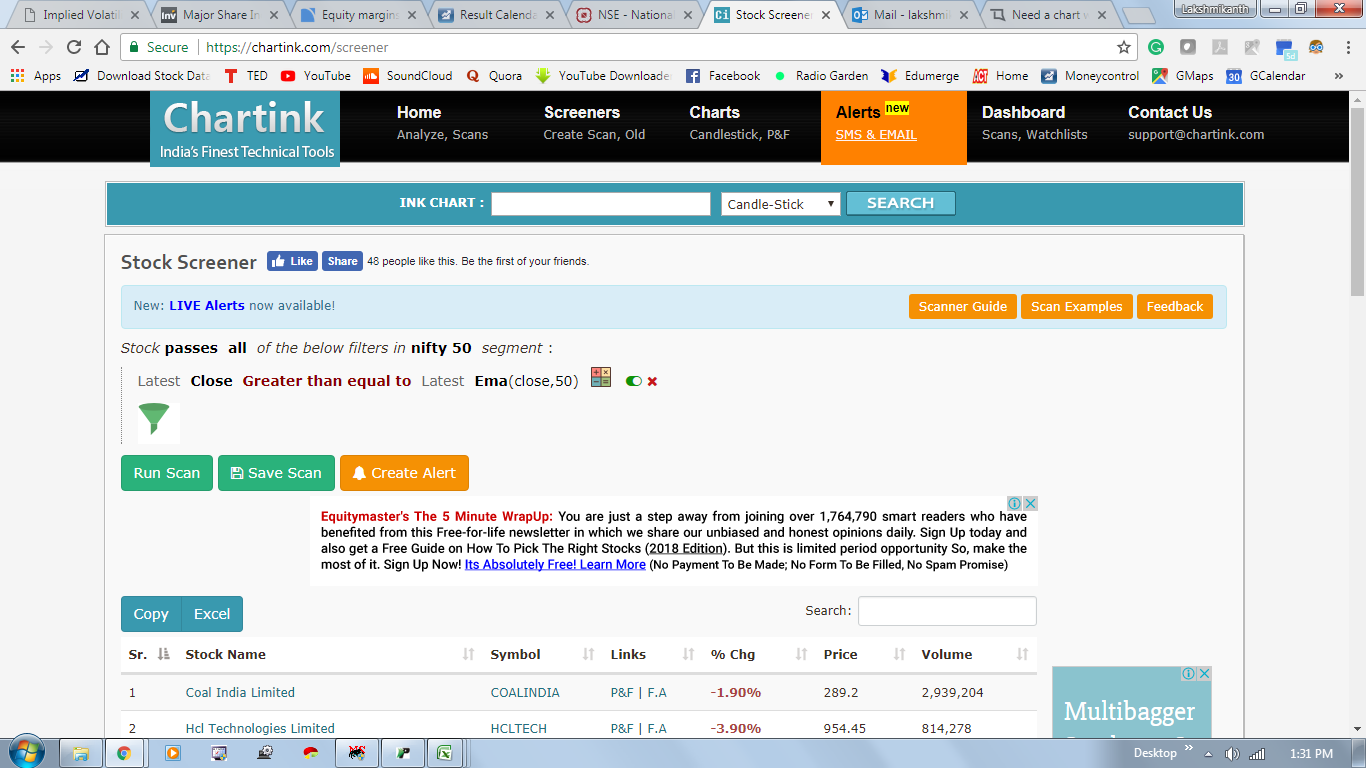
@mknits You can do one for Nifty 50, run the above scan at EOD, you will get the stocks and the number of them, divide it by 50 and you will have the %age of stocks over 50 EMA. On the similar lines, you can do one for Nifty 100 as well
1 Like
Thanks, this worked.
Could you tell me which one is better an why - SMA or EMA? I think this chart is using SMA http://stockcharts.com/h-sc/ui?s=%24SPXA50R
You can use either of the 2, that should not matter.
EMA is better because it is effected by the most recent information available so yes its more sensitive but also more accurate and immediately useful.