Hi,
I want explore the scripts to identify the scripts which meet certain criteria (eg RSI for 5 mins and RSI for 30 mins both greater than 60).
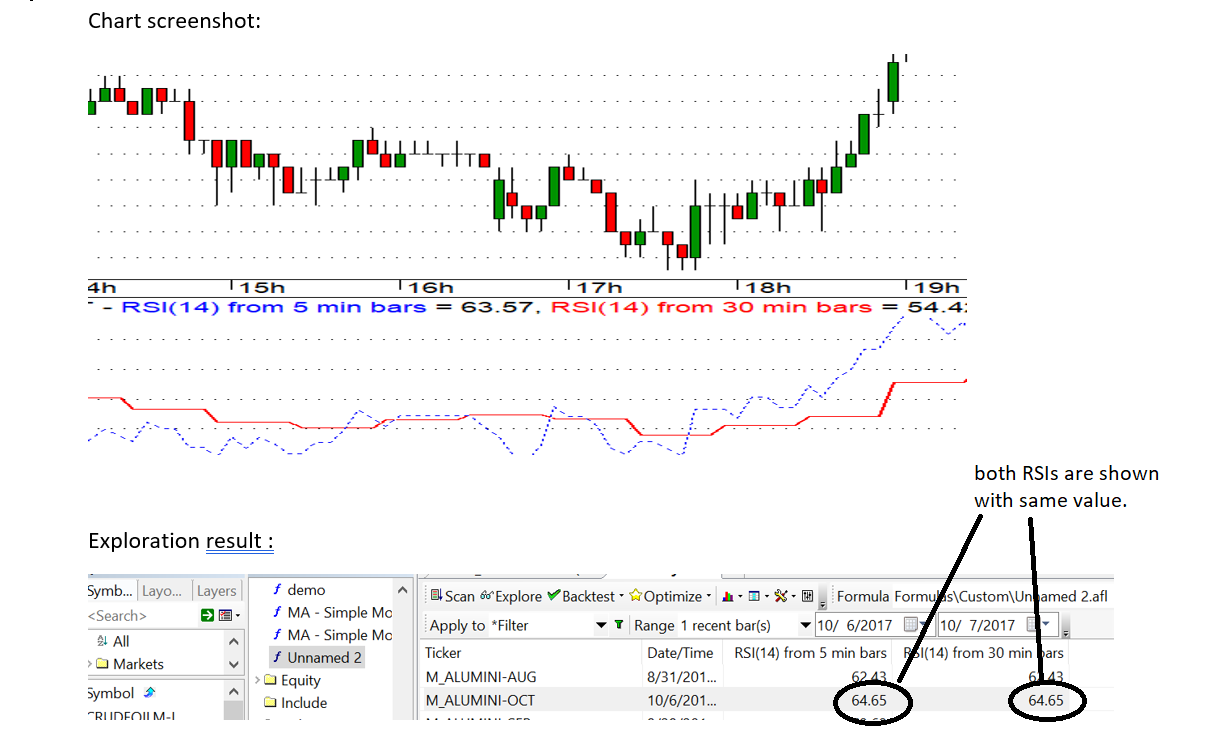
I wrote a code, the chart shows the RSIs correctly. But exploration does not work correctly. At the same time, value in the added columns shows incorrect data. Can Experts please look into it.
Code is here:
TimeFrameSet( in5Minute ); // switch to 5 minute time frame
rs5=RSI(14);
TimeFrameRestore(); // restore time frame to original
TimeFrameSet( 2*in15Minute ); // switch to 30 minute time frame
rs30=RSI(14);
TimeFrameRestore(); // restore time frame to original
// Charting //
a=TimeFrameExpand( rs5, in5Minute);
b= TimeFrameExpand( rs30, 2in15Minute);
Plot( TimeFrameExpand( rs5, in5Minute), “RSI(14) from 5 min bars”, colorBlue, styleDashed );
Plot( TimeFrameExpand( rs30, 2in15Minute), “RSI(14) from 30 min bars”, colorRed, styleThick );
Filter=rs5>60 AND rs30>60;
//Filter=a>60 AND b>60;
//I tried this one also. Still showing same value in both columns(5 Mins RSI & 30 Mins RSI) though chart shows two different RSIs.
//filtering does NOT happen properly.
AddColumn(a, “RSI(14) from 5 min bars” );
//AddColumn(rs5, “RSI(14) from 5 min bars” );
//** this also did not work//
AddColumn(b, “RSI(14) from 30 min bars”);
//AddColumn(rs30, “RSI(14) from 30 min bars” );
//** this also did not work
Screenshot:
Thanks,
Satyendra