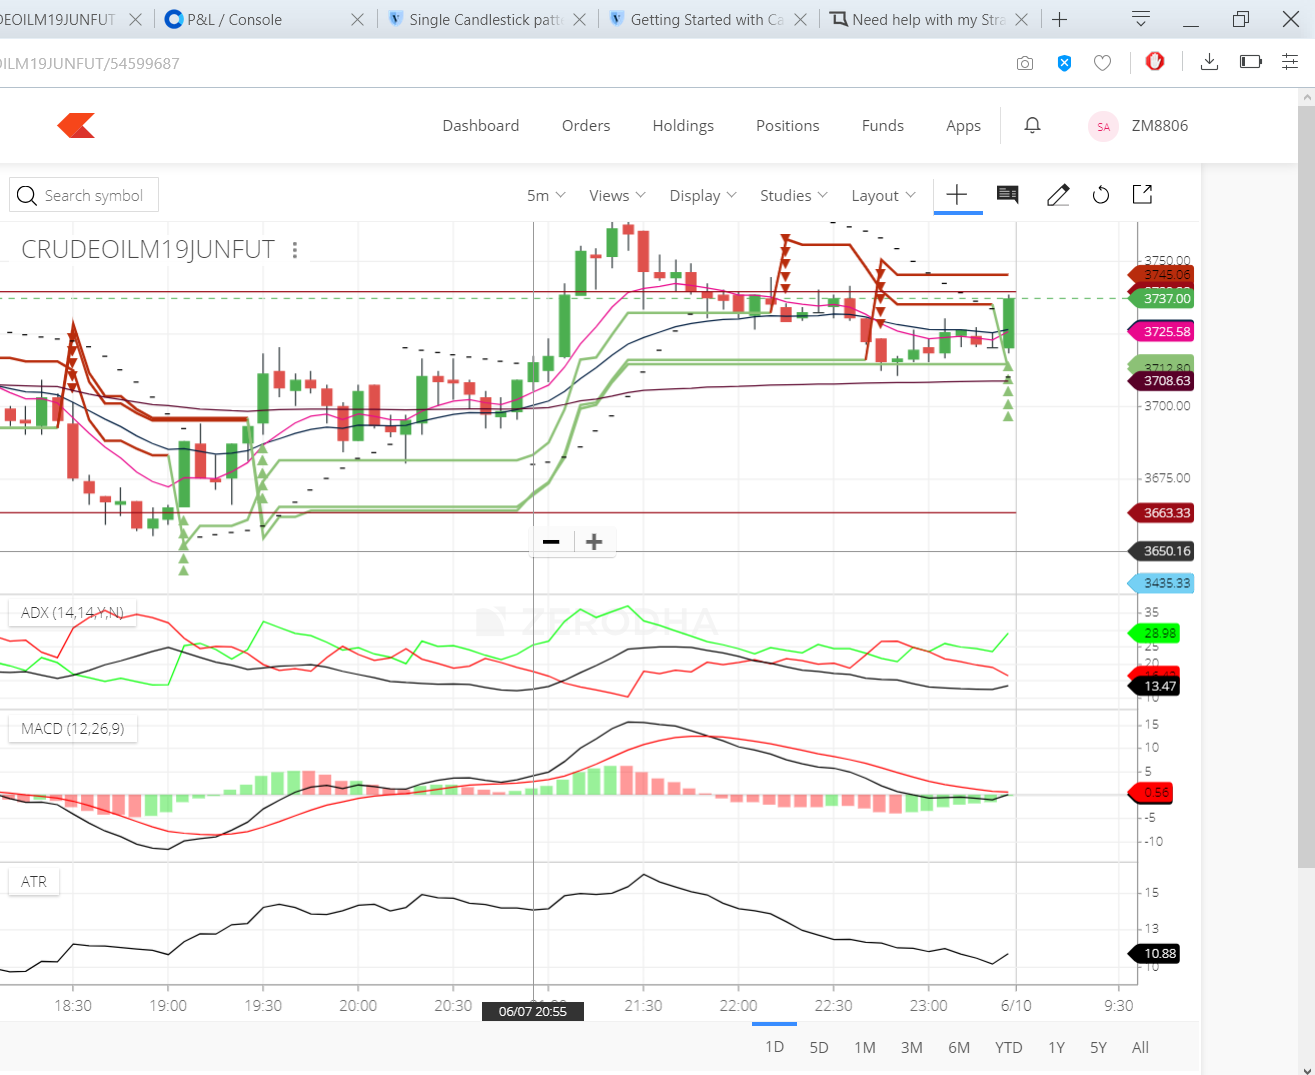
i am new to trading and have been learning technical analysis since past few months and in the picture you can see my Strategy, which is:
combination of three super trend.
Adx
MACD
PSAR
EMA
my Strategy is to sell when :
super trend create red arrow and adx above 25 with MACD red line above the black line.
and to buy vice versa.
now the problems i am facing are :
i enter when the signals confirm and i don’t know when to exit.
before taking the trade i confirm with both 5 min and 15 min candle stick,but while waiting for 15 min candle sticks,a 10-15 points have happened and i miss these points.
most of the time there is more slippage,for example if the signal to sell is confirmed and i enter the trade at 3570 but it goes till 3600 and then comes below 3570. how can i avoid this huge slippage.
i do intraday on crude oil mini.!
Dnt waste your time in indicators/oscillators. Make a strategy either on volume (only important thing in stock mrkt which drives price) or price (second mst important)
A strategy on indicator cant wrk fr a long time(even fr a short time as poor indicator itself follows price n you expecting it to Predict price
In this case ATR can help you , here i am posting one of the threads url by one of the trading qna member , which will be helpful for you
slippages are common in trading , especially on volatile futures like crude. Obviously chart indicators are slow , and it should be, simply they follow price , but they indicate in advance , price action happens later , only thing is, you have to practice how to use it, to minimize slippages its better to use higher candle stick like 30 minute or hourly charts to know the direction and enter the trade on lower time candle stick.
Your screen shots are not visible , can you post it again?
well i agree with you. i have been trying to learn price action trading based on candlestick patterns. but the problem is that i am a student and can not sit in front of the screen all day.
Well , If you prepare your trading plan in advance , there is no need to sit in front of the screen all day , i am also working/ studying , i prepare my trading plan at the end of the day , using EOD charts, i watch charts , in between , during the trading hours just to manage the trade , i don’t sit in front of the screen whole day. I think you are using too shorter duration charts, especially , Super trend generates more whipsaws on shorter time duration.
The link which i posted is not broken , and posting it again for you ,
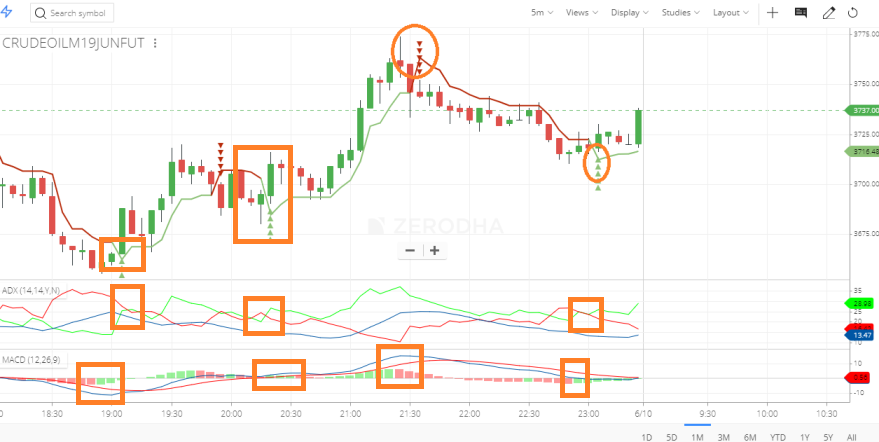
yeah posted the screenshot below again.
so if i am watching the chart and i see a hammer at the bottom trend, then should i buy.
and i am thinking of using 5 minutes chat or 15 minutes. and is there any other way to confirm the trade… because i think just by seeing a hammer at the bottom…i shouldn’t buy it… it would be better if there are more signals. i hope you are understanding my point.
The only way indicators make any sense are on larger time frames…you need to plot all these indicators on 4h chart and when you get a signal on 4h tf , just look to time your entry on 5 min chart…also you should know where to exit before you enter.
If you are a scalper , its ok to trade only on 5min or 15 min candle , since scalp & day trading is highly risky and need much more trading experience, In my experience positional trading is much better than day trading. I think you need to look at day chart or weekly chart before entering a trade on 5min or 15 min chart, and also you need to work / back test
on chart indicator interpretation and settings ,which indicator to be used , fewer indicators are much better and many times all the indicators show the same thing .
Like @maddy_Des said position sizing and money management is more important than charting.
Don’t mind son. Your strategy is too complex and thus useless. I believe our Mangalayan Mission strategy was technically simpler than your charts.!! Jokes apart. This is not the way to trade and make profits.
I do not know your background - education, student or working, age, and most importantly how much capital you have to lose. Yes only enter in day trading if you are okay to lose all your capital.
Day trading survival is a long strenuous journey and over that making consistent profits (say 6 months in a row) is almost hard for anyone into day trading in the first 2 to 3 years.
Learn, trade (only to extent you are okay to lose), again learn. And lastly get a mentor (which itself a difficult task)
yeah,i agree that it is quite complex. i have removed ADX because it is not working well in intraday and also i am thinking to take confirmations from both 5 min and 10 min candlestick while trading crude oil.
it’s very simple entry and exit should be based on same criteria and in the same time frame , but if you can’t do like that then you need to improve you strategy to simplify it more. or you can have target or you can just get out in profit because a TRADE is a loss! you will never go broke by taking profits .