Hey there!
We are super pumped to announce the launch of Option Strategy Charts on Sensibull.
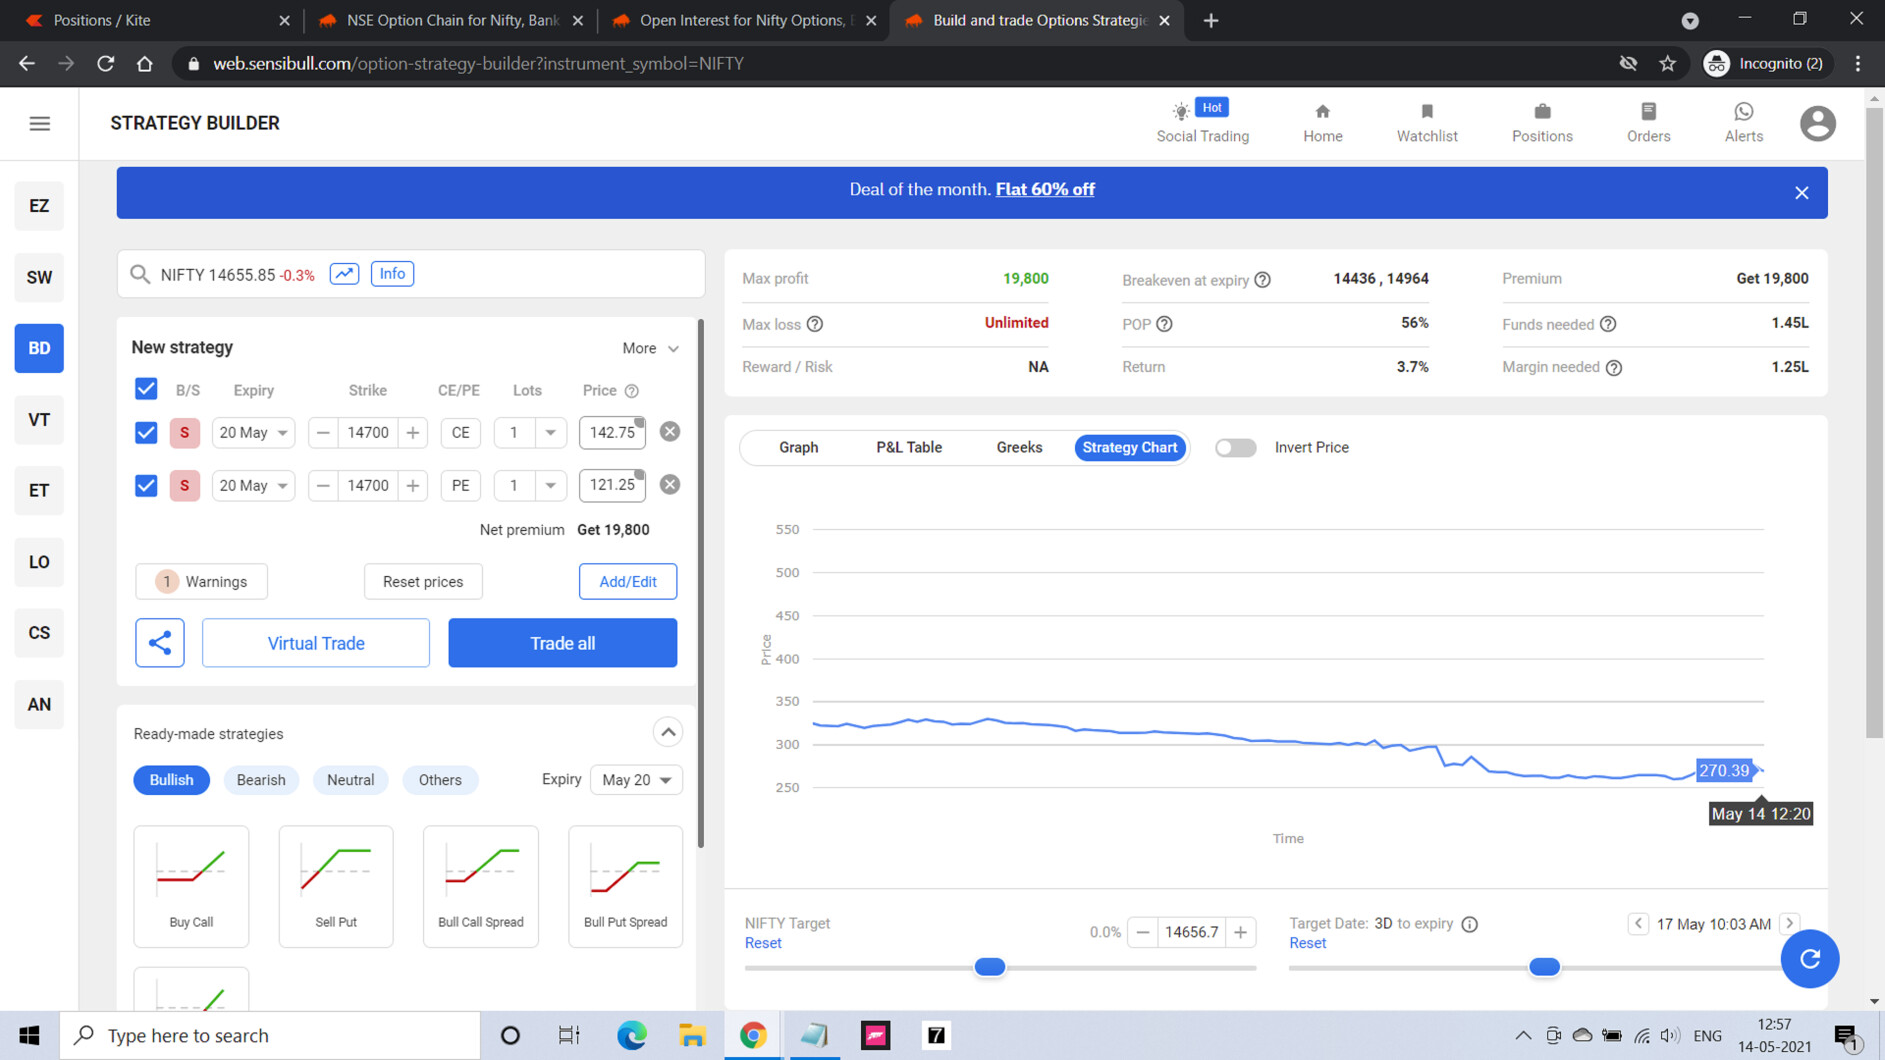
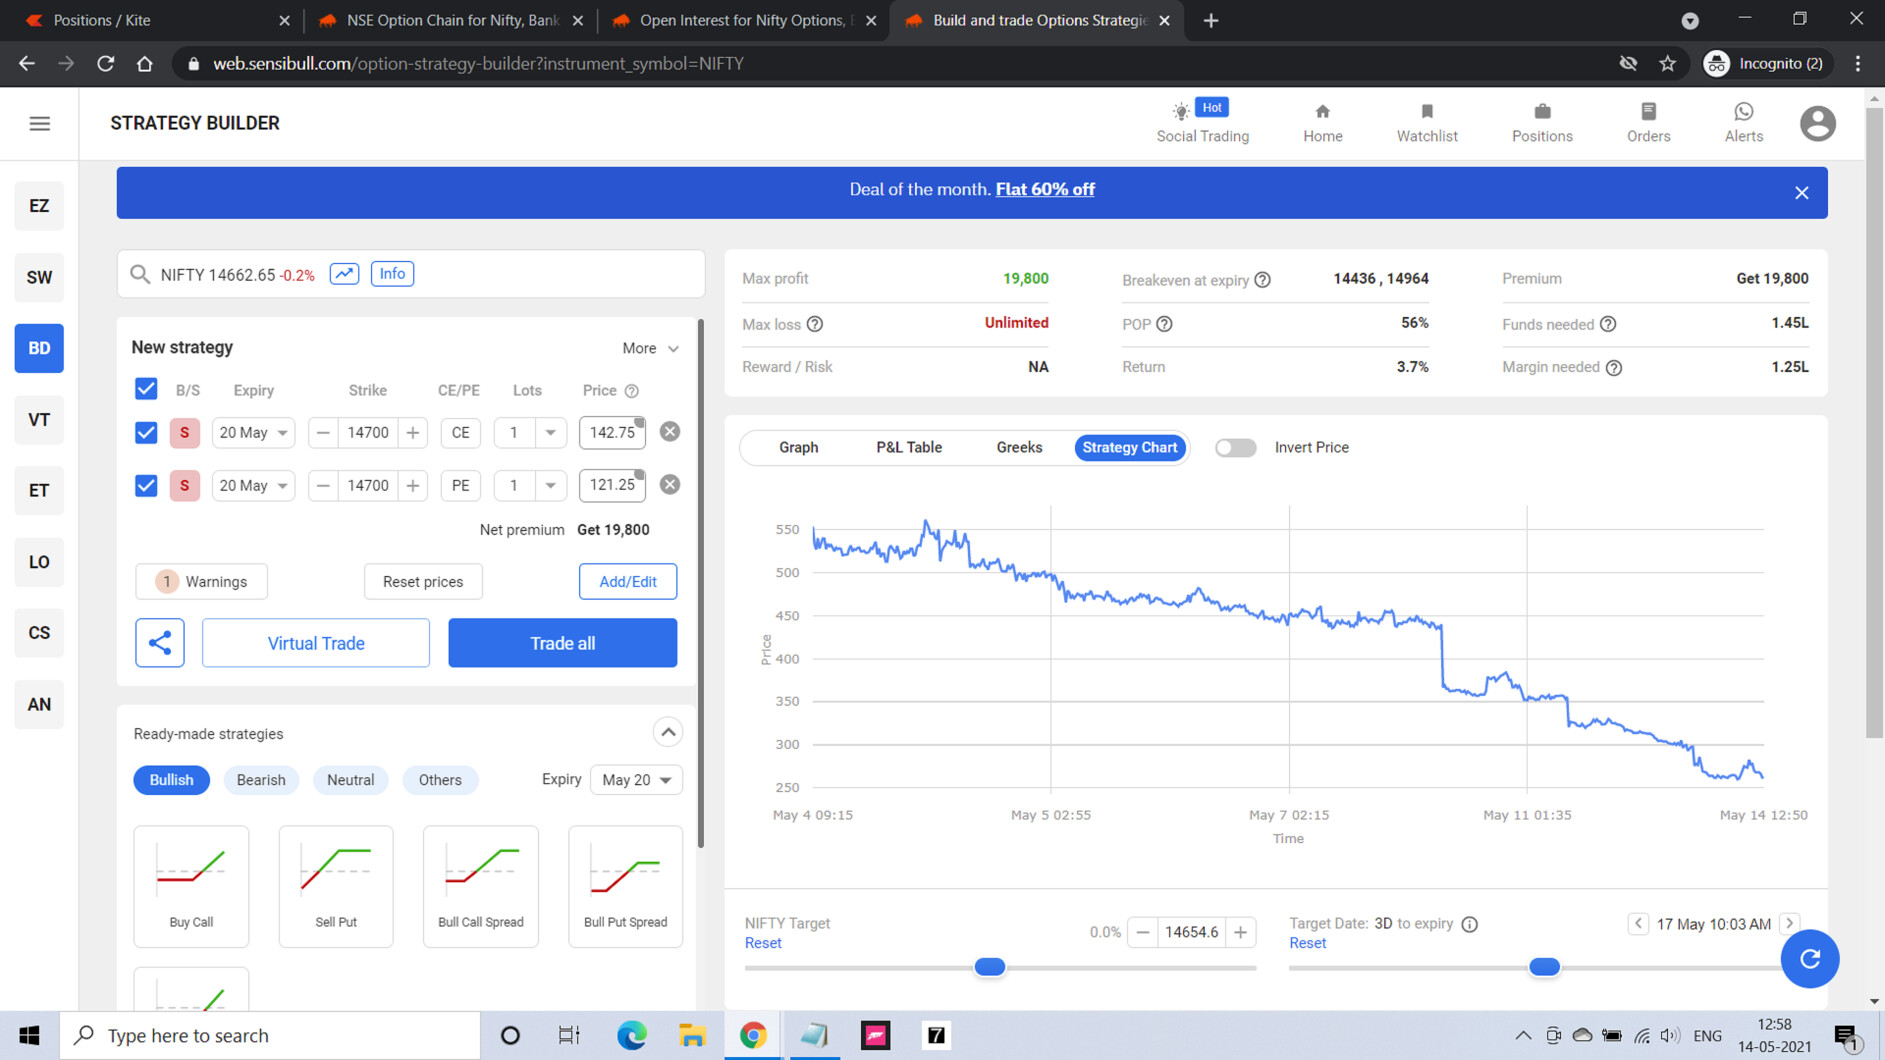
Now you can visualise how a strategy has performed in the last few days using strategy builder.
Strangle, Straddle, Spread, Ratio, Condor, Weirdor, anything!
Check it out here
https://web.sensibull.com/option-strategy-builder
What can this chart do?
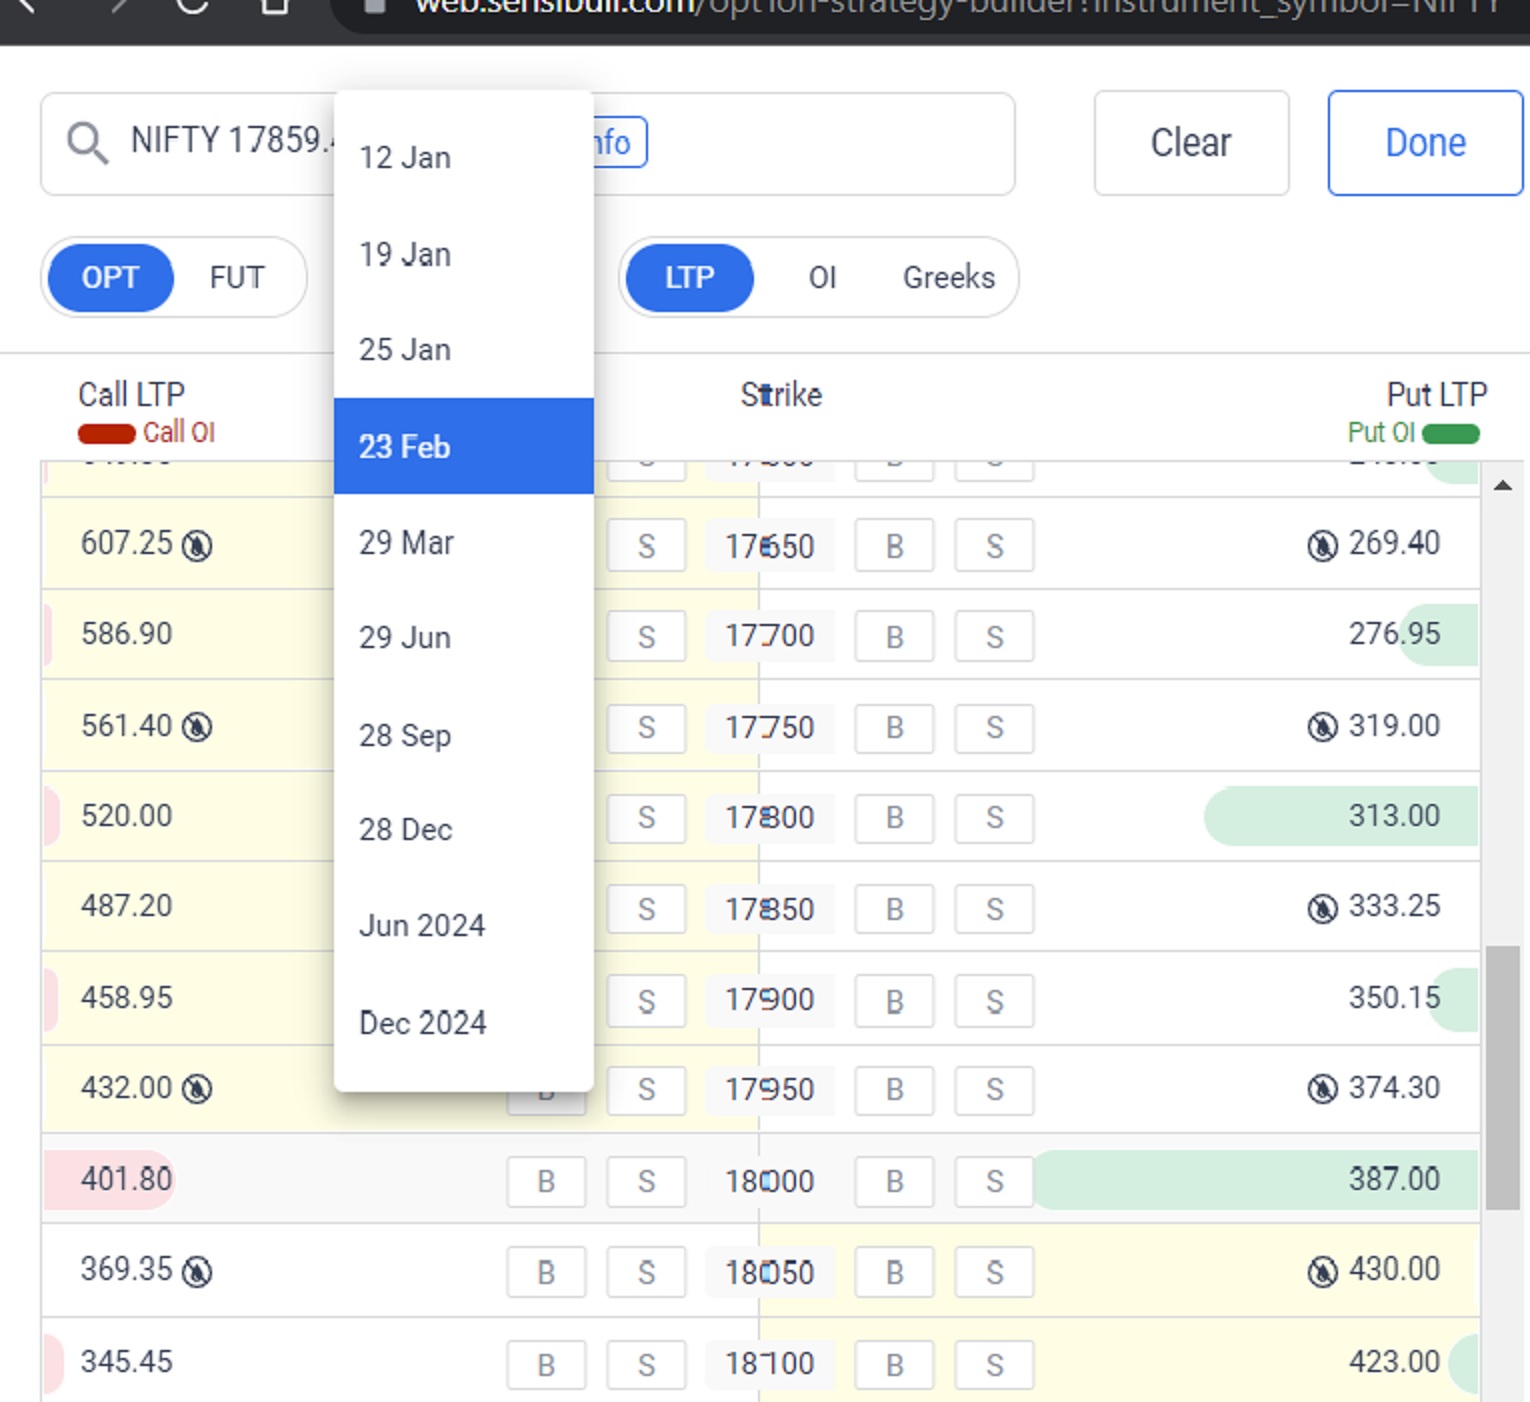
You can create any strategy of your choice on the builder, or use a ready-made strategy, and the strategy chart will plot the performance of this strategy in the last few days.
How does this help
In two ways - 1, it tells you how the strategy has performed in the last few days, that gives you a sense of the trend of this strategy. And since common strategies may be analysed using technicals (maybe), you can do technical analysis on the chart of a strategy
What time frame is it?
This is a 5-minute timeframe chart. We will introduce variable time frame analysis on this soon.
What else is coming on this
We will turn on the plot of the underlying in the same chart in the coming days so that you can see how a strategy performs with the change in underlying
Here is a demo video