Welcome to Kya Lag Raha Hai Market, your daily look at NIFTY and BANK NIFTY predictions and market analysis with Abid Hassan from @Sensibull. We analyse options trading by tracking candlestick patterns, price action, FII-DII data, support and resistance levels, open interest, option chain moves, trend formations, and risk-reward setups to help you navigate the markets better.
Disclaimer: This content is purely for educational purposes and does not constitute investment advice or stock tips. The aim is to help you understand derivative data, option trading strategies, and technical analysis better.
Chart Analysis
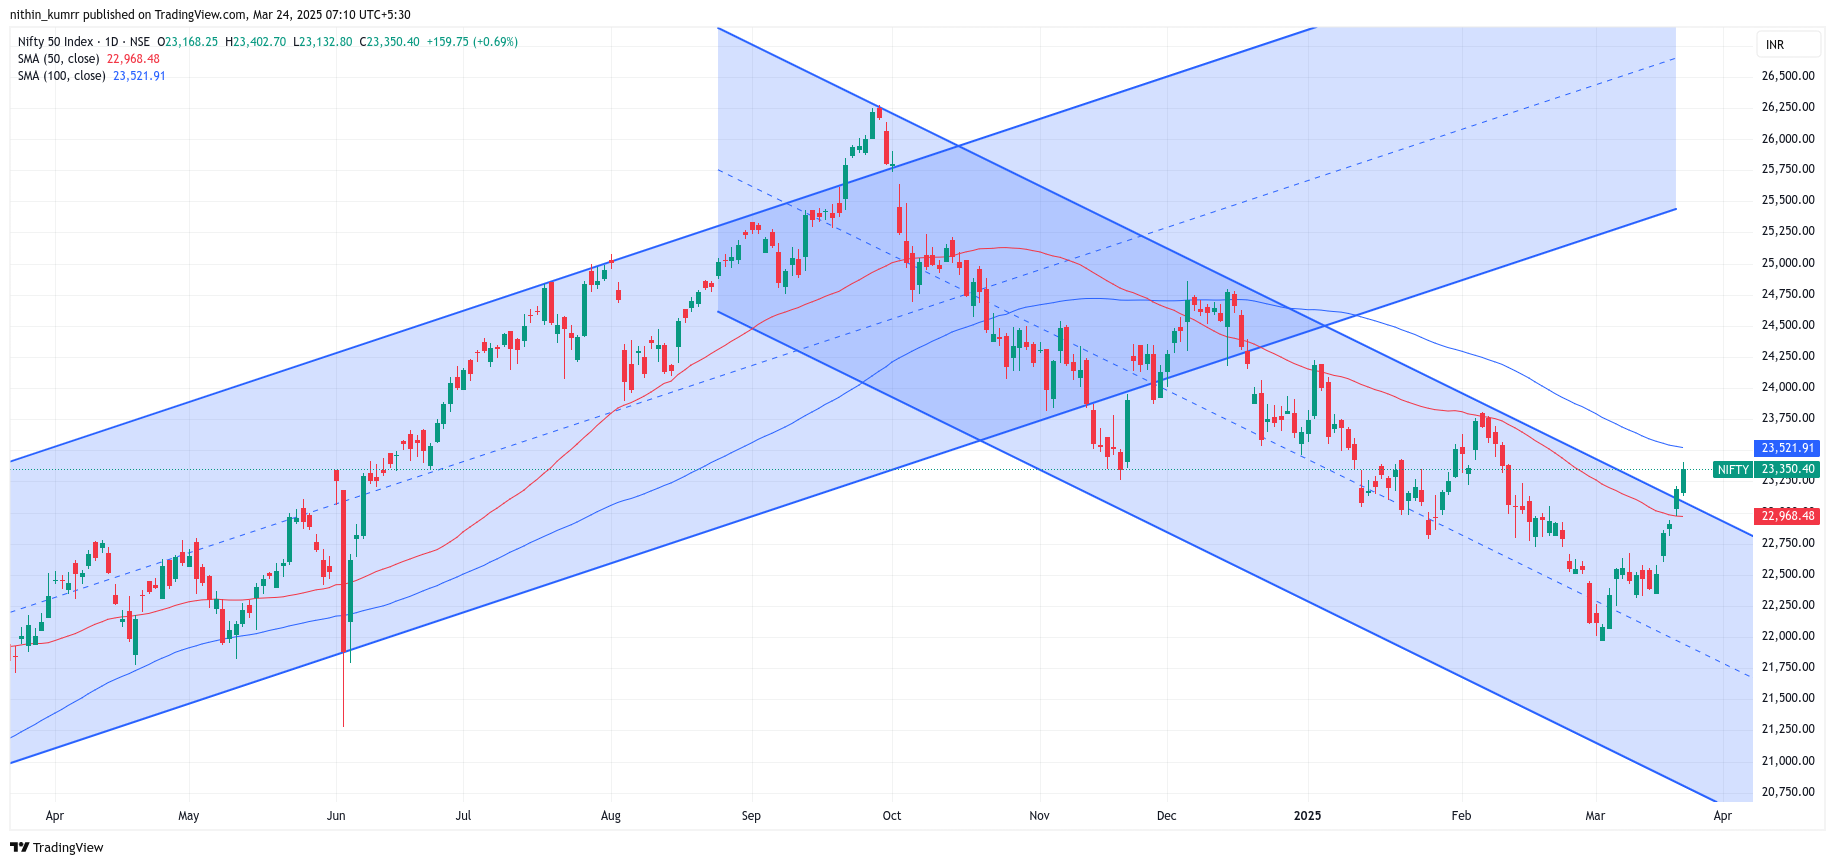
NIFTY:
- At exit poll day resistance, close to breaking.
- Weekly candle: Big bullish engulfing.
- Monthly candle: Imperfect Harami.
- Near 200 DMA at 23,500 zone.
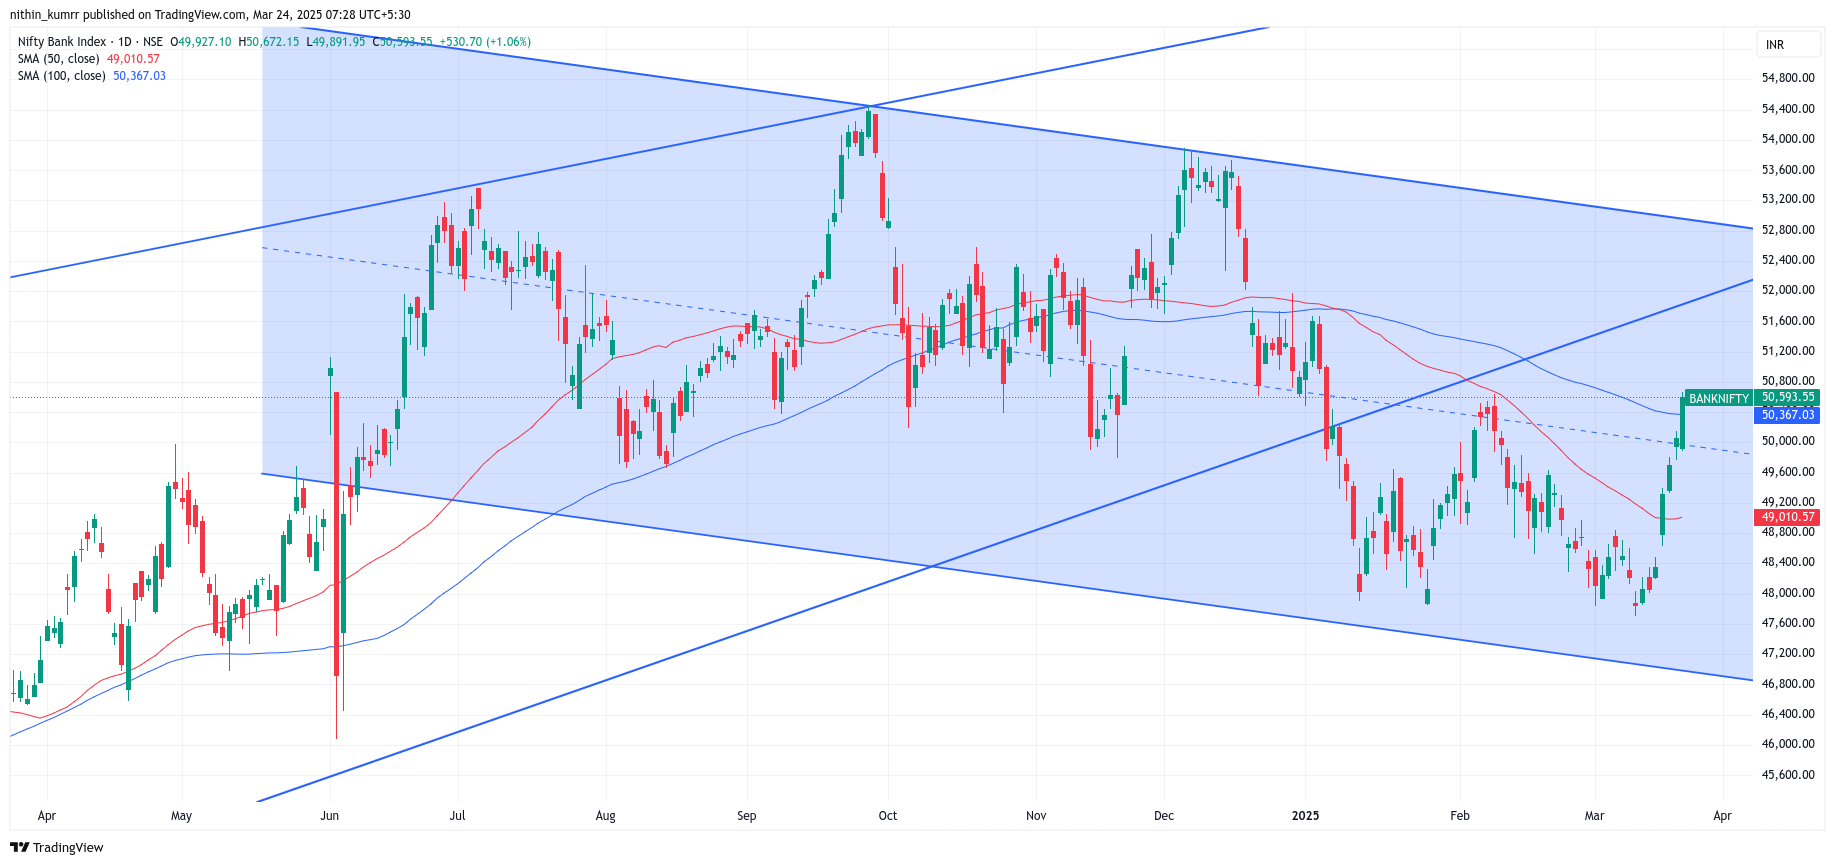
BANK NIFTY:
- Above the middle of the channel.
- Crossed 200 DMA.
- Bullish engulfing on daily charts.
Options Chain Data: Key Levels
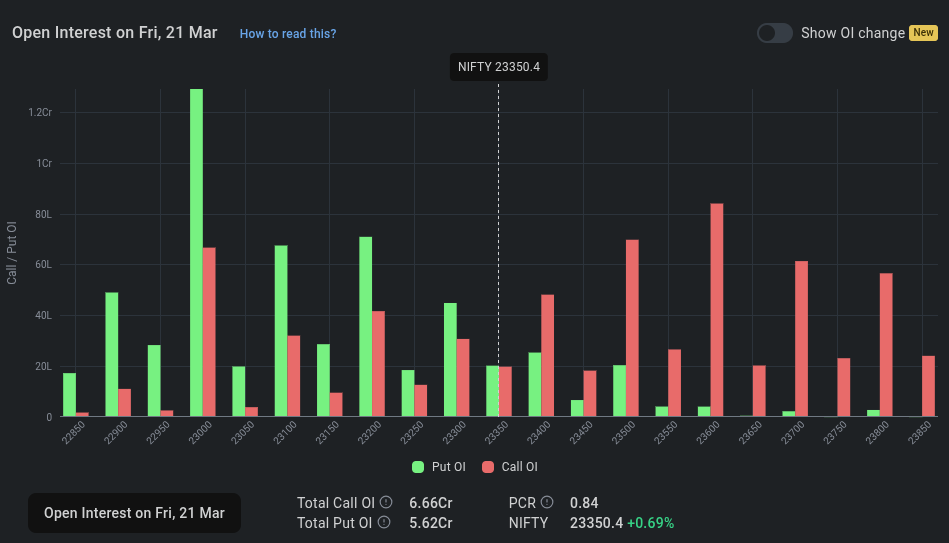
Support: 23,200
Resistance: 23,500+
PCR (Put-Call Ratio): 1.1 overall and 0.8 around ATM - Neutral to bullish
Participant Options Data
| Participant | Calls | Puts | Comment |
|---|---|---|---|
| FII | Long 1.7 L | Long 1.4 L | Positive Bias |
| Pro | Long 1.3 L | Short 1.52 L | Positive Bias |
| Client | Short 3 L | Almost None | Heavily Short |
Summary: FII & Pro are long, Client is heavily short in the markets.
FII DII Data Summary: Sensibull
Participant Futures Data
- FII: Unwinding shorts, bought ₹2,000+ Cr in futures on Friday.
- Client: Rapid long unwinding.
FII DII Futures and Options Data: Sensibull Analyse
Participant Stock Data
FII Index Futures: Bought ₹2,419 Cr (Bullish)
FII Options:
-
Call OI change: -18,261 (Bearish)
-
Put OI change: -56,921 (Bullish)
FII Cash: Bought ₹7,470 Cr (Bullish)
 Verdict
- There might be more upside left.
- Avoid adding any fresh shorts here.
 Trade Plan and Approach
- Will wait till a reversal signal appears.
- Not participating in the upside move due to too many resistances above.
Watch the full analysis video here:
What’s your view? Curious to hear how you’re looking at this, feel free to share your thoughts or levels you’re tracking. ![]()