Hi everyone!! On this link, NSE provides PE ratio, PB ratio & Dividend yield of its indices - https://www.nseindia.com/products/content/equities/indices/historical_pepb.htm
I download data from here & try to maintain it in an Excel sheet. Additionally, I back-calculate EPS, BVPS & DPS from that data & the Index Values for the day. However in some recent PE data of “Bank Nifty”, I have noticed some sharp fluctuations in PE Ratio & consequently in EPS , which is making me doubt the data itself. Here are some screenshots for your reference.
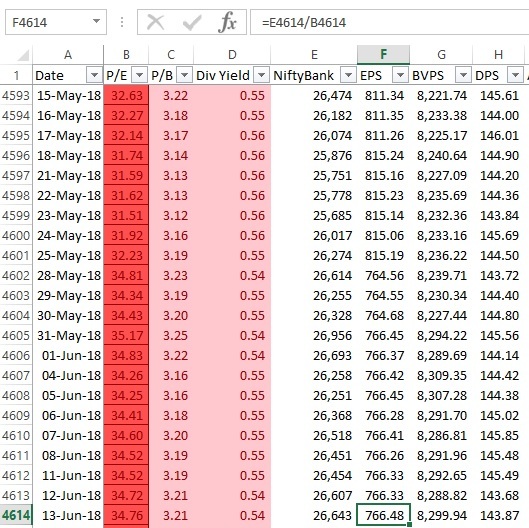
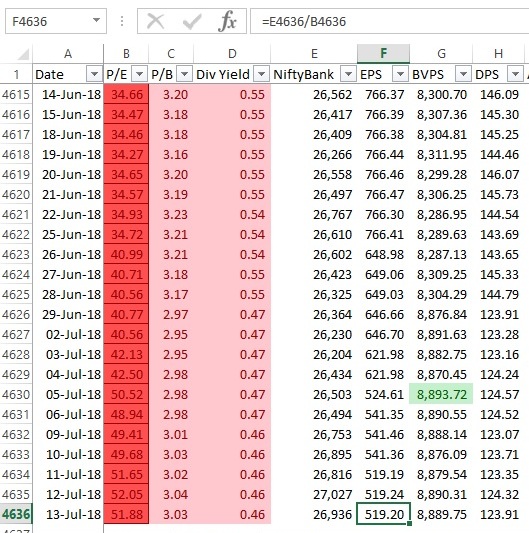
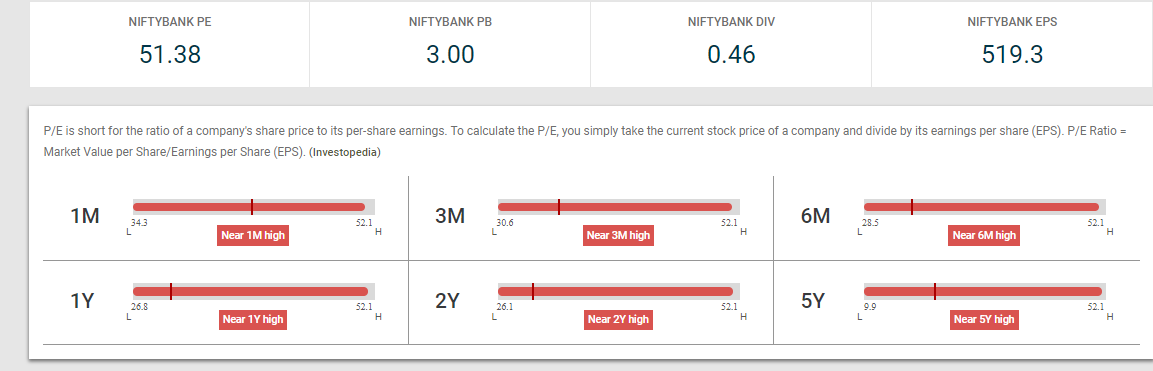
As you can see the EPS values, how it has declined from 800+ to about 520 levels. One may say it is because of SBI & Axis losses, but still it seems too far fetched. Right now, Bank Nifty is trading at record 50 PE levels!! Am i missing here something or is there something wrong with NSE data itself??