When developing a systematic trading strategy, one of the easiest mistakes is to look at the final P&L and simply choose the instrument that made the most money.
But a strategy that generates higher profits may also require more trades, higher drawdowns, more capital, or greater psychological tolerance.
To investigate this, I compared the performance of the same trading strategy on 30-minute NIFTY futures data and 30-minute Gold Mini futures data. The comparison covers approximately ten years of historical data for each instrument and evaluates the systems across profitability, risk, drawdown, expectancy, reward-to-risk characteristics and consistency.
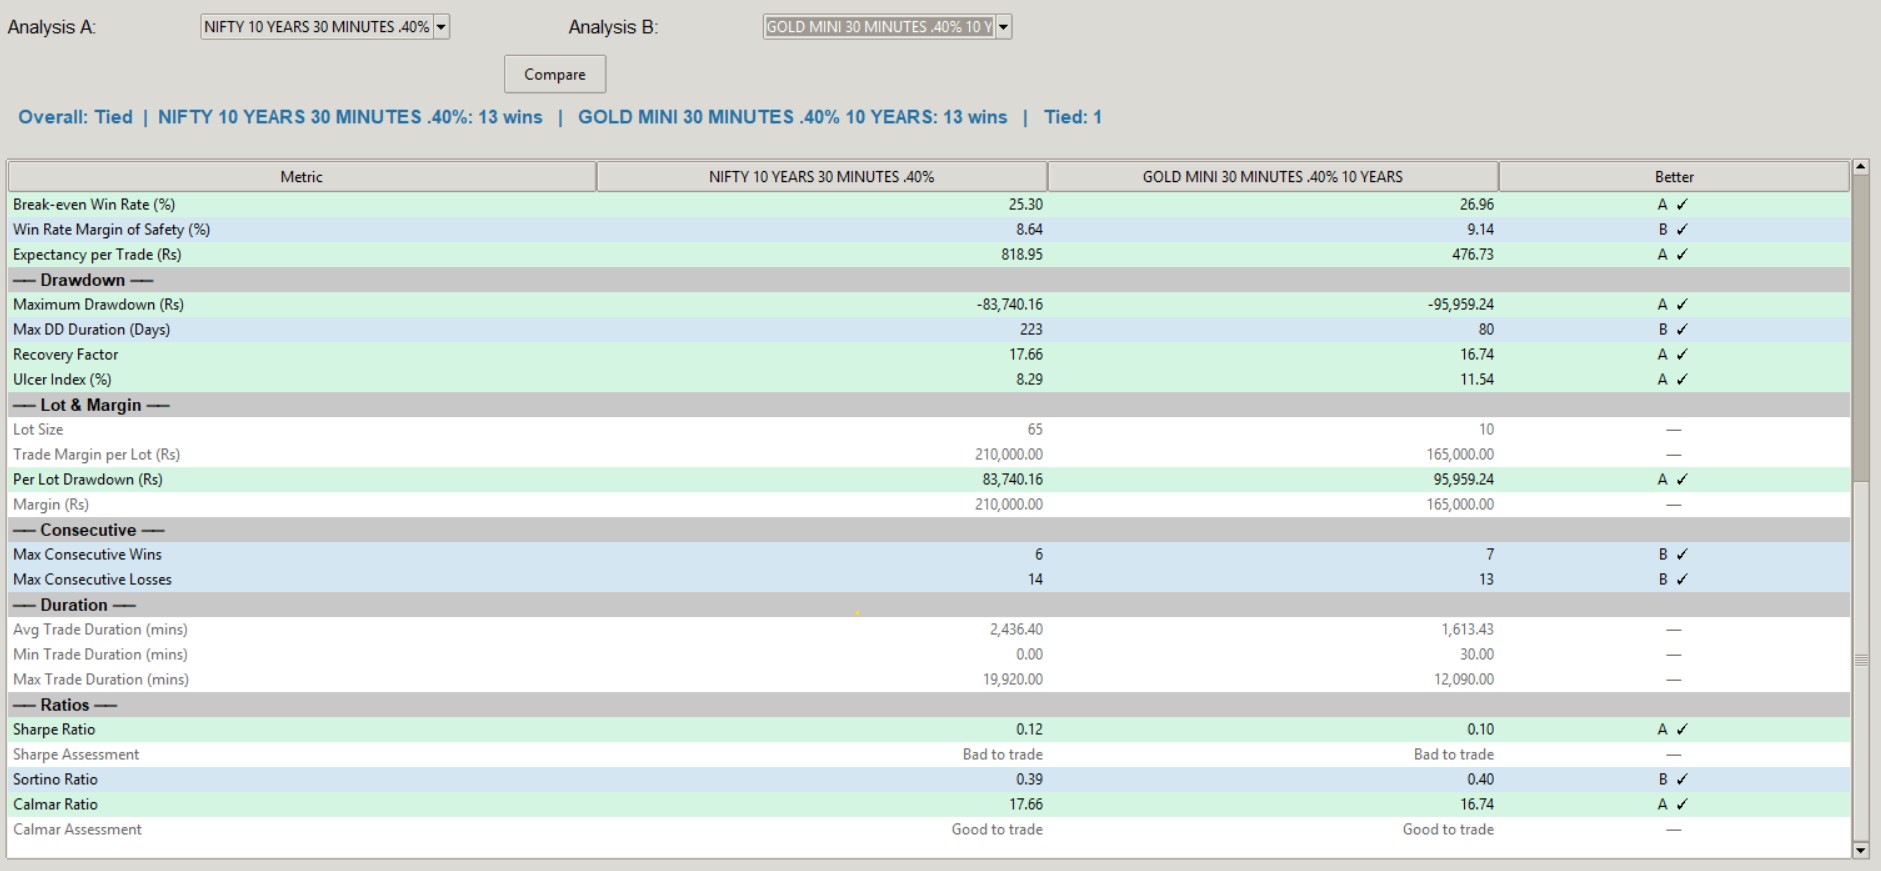
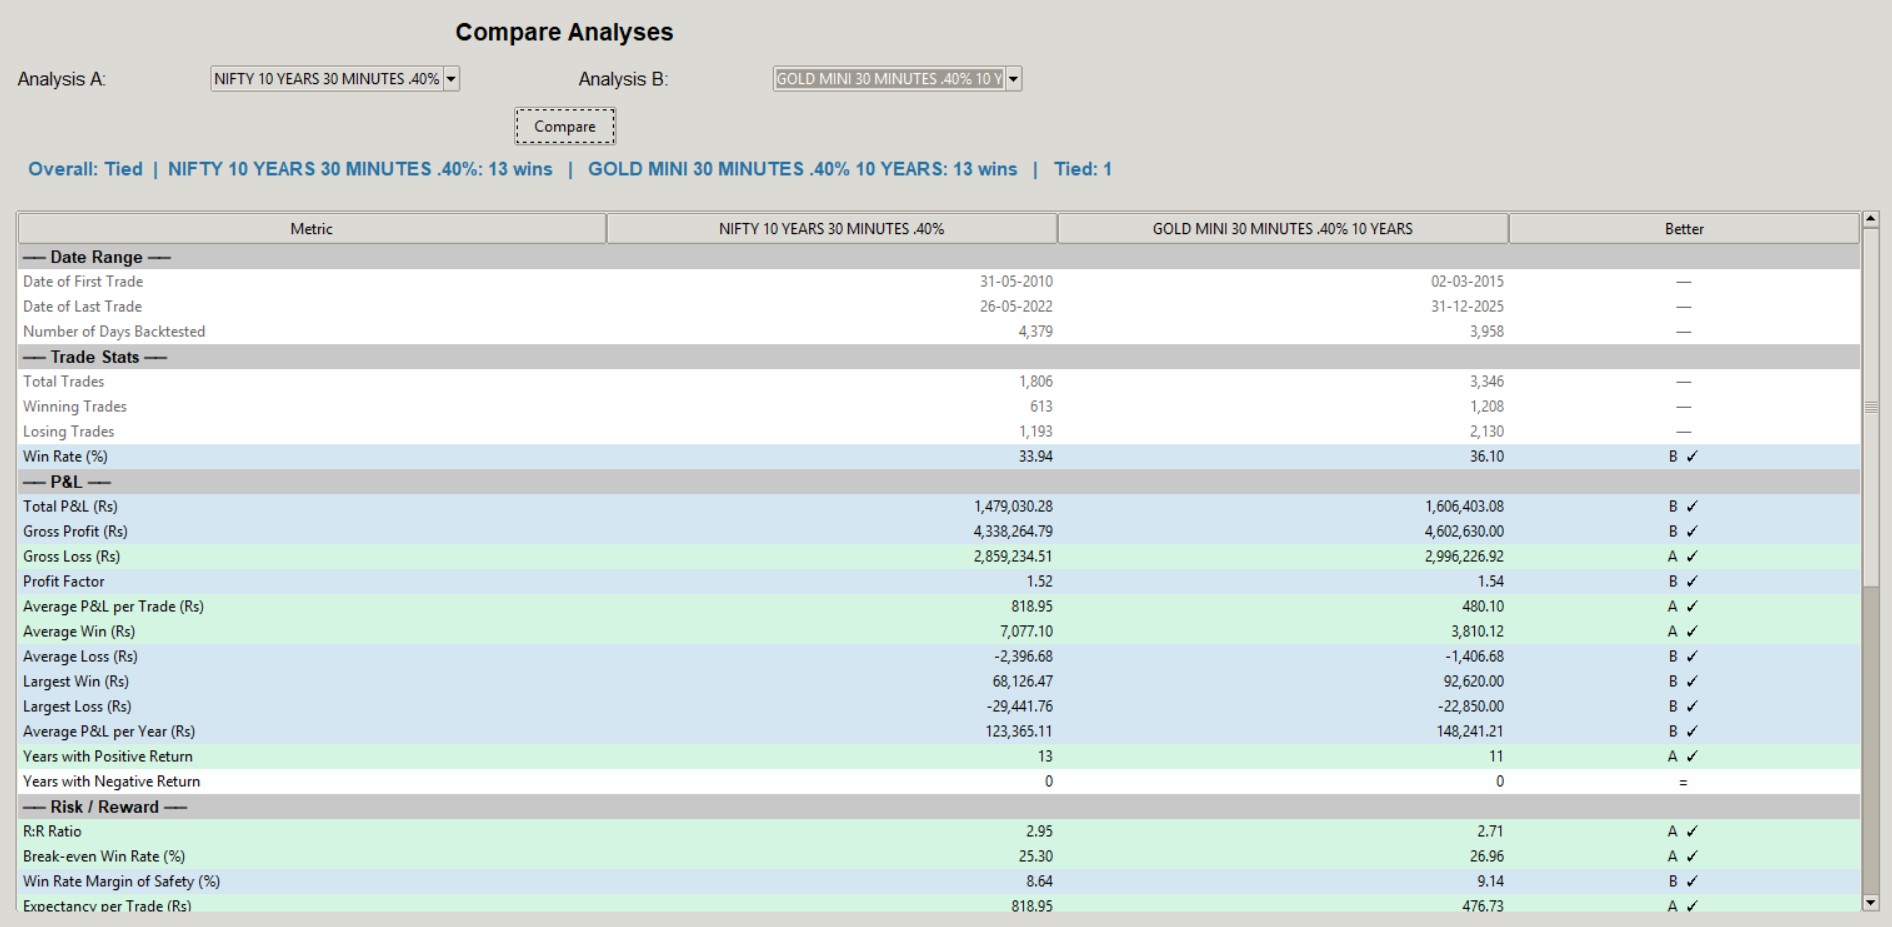
The result was surprisingly close: NIFTY won 13 metrics, Gold Mini won 13 metrics, and 1 metric was tied.
So this isn’t a case where one instrument completely dominates the other. Instead, the comparison reveals two different strengths.
The headline numbers
| Metric | NIFTY | Gold Mini |
|---|---|---|
| Total P&L | ₹14.79 lakh | ₹16.06 lakh |
| Total Trades | 1,806 | 3,346 |
| Win Rate | 33.94% | 36.10% |
| Profit Factor | 1.52 | 1.54 |
| Average P&L / Trade | ₹818.95 | ₹480.10 |
| Maximum Drawdown | ₹83,740 | ₹95,959 |
| Maximum DD Duration | 223 days | 80 days |
| Recovery Factor | 17.66 | 16.74 |
| Ulcer Index | 8.29 | 11.54 |
| R:R Ratio | 2.95 | 2.71 |
| Maximum Consecutive Losses | 14 | 13 |
| Sharpe Ratio | 0.12 | 0.10 |
| Sortino Ratio | 0.39 | 0.40 |
| Calmar Ratio | 17.66 | 16.74 |
Gold Mini made more money — but it needed almost twice as many trades
The Gold Mini version generated approximately ₹16.06 lakh, compared with ₹14.79 lakh for NIFTY. At first glance, Gold appears to be the winner.
However, Gold generated 3,346 trades, while NIFTY generated only 1,806 trades. That means Gold required roughly 85% more trades to generate only about ₹1.27 lakh more total profit.
The average P&L per trade was ₹818.95 for NIFTY and approximately ₹480 for Gold Mini. NIFTY therefore generated substantially more expectancy per trade.
This leads to an interesting conclusion: Gold wins through trade frequency, while NIFTY wins through trade efficiency.
NIFTY has the better reward-to-risk profile
The R:R ratio was 2.95 for NIFTY and 2.71 for Gold Mini. This is a meaningful difference.
The higher R:R of NIFTY allows the strategy to remain profitable despite having a relatively low win rate. NIFTY’s historical win rate was only 33.94%, meaning the strategy lost on approximately two-thirds of its trades.
Yet it remained profitable because its winning trades were substantially larger than its losing trades.
The same principle applies to Gold Mini, which had a slightly higher win rate of 36.10%, but a lower R:R ratio.
This is an important reminder that win rate by itself is a poor measure of strategy quality. A low-win-rate strategy can outperform a high-win-rate strategy if the payoff distribution is favorable.
NIFTY also has the lower maximum drawdown
Maximum drawdown is one of the most important numbers in a trading system because it represents the largest peak-to-trough decline experienced by the strategy during the test.
NIFTY’s maximum drawdown was ₹83,740, compared with ₹95,959 for Gold Mini. NIFTY therefore had approximately ₹12,219 less maximum drawdown.
This is another advantage for NIFTY. However, there is an interesting twist.
Gold recovered from drawdowns much faster
Although Gold had the larger maximum drawdown, its maximum drawdown duration was dramatically shorter: 80 days versus 223 days for NIFTY.
This means the Gold system experienced a deeper maximum drawdown in absolute rupees, but it did not remain underwater for nearly as long.
For a trader, this distinction can be extremely important. A ₹1 lakh drawdown that lasts a few weeks can be psychologically very different from an ₹80,000 drawdown that takes several months to recover.
Therefore, maximum drawdown should not be viewed in isolation. The depth and duration of drawdown both matter.
The Ulcer Index gives NIFTY another advantage
The Ulcer Index was 8.29 for NIFTY and 11.54 for Gold Mini. Lower is better.
The lower Ulcer Index for NIFTY suggests that its equity curve was less painful overall.
This creates an interesting contrast: Gold recovered from its worst drawdown faster, while NIFTY experienced lower overall drawdown stress according to the Ulcer Index.
So Gold’s drawdown profile is not simply better or worse; it behaves differently.
Gold has a slightly better Profit Factor
Profit Factor compares gross profits with gross losses. The results were 1.52 for NIFTY and 1.54 for Gold Mini.
Gold has a very small advantage here. However, the difference is too small to make a strong conclusion by itself.
Both systems are above 1.0, meaning gross profits exceeded gross losses over the tested period. Profit Factor should always be interpreted together with trade count, transaction costs, drawdown and out-of-sample performance.
In this case, the fact that the two numbers are almost identical is actually more interesting than the tiny difference between them.
The average winning trade tells a different story
The average winning trade was ₹7,077 for NIFTY and ₹3,810 for Gold Mini. NIFTY’s average winner was almost twice as large.
The average losing trade, however, was also larger: −₹2,396 for NIFTY and −₹1,407 for Gold Mini.
So NIFTY essentially operates with a larger payoff structure on both sides. This is consistent with its higher R:R and higher expectancy.
Gold, on the other hand, produces smaller wins and smaller losses, but generates many more trading opportunities.
What about losing streaks?
Maximum consecutive losses were 14 for NIFTY and 13 for Gold Mini. The difference is small, but it highlights an important practical consideration.
A trader running either system should not assume that a strategy with a 33–36% win rate will produce a smooth sequence of results.
The historical data already shows losing streaks of around 13–14 trades. Historical maximums should never be treated as guaranteed future maximums. A live system can experience a longer losing streak than anything seen in the backtest.
This is why capital allocation should be based on stress testing rather than simply using the historical maximum drawdown as the required capital.
Risk-adjusted returns tell an interesting story
The Sharpe Ratios were low for both systems: NIFTY 0.12 and Gold Mini 0.10. NIFTY has a slight advantage.
The Sortino Ratios were 0.39 for NIFTY and 0.40 for Gold Mini, giving Gold a marginal advantage.
The Calmar Ratios were 17.66 for NIFTY and 16.74 for Gold Mini, so NIFTY wins again.
This is a good example of why no single risk-adjusted metric should determine the decision. Sharpe, Sortino and Calmar measure different aspects of risk-adjusted performance.
So, which one is actually better?
NIFTY is the more efficient trading vehicle. It provides higher expectancy per trade, higher average winning trade, better R:R, lower maximum drawdown, lower Ulcer Index, higher Recovery Factor, higher Calmar Ratio and fewer trades required to generate similar overall profit.
Gold Mini is the more active trading vehicle. It provides higher total historical P&L, higher annual average P&L, higher win rate, slightly higher Profit Factor, shorter maximum drawdown duration and slightly fewer consecutive losses.
Therefore, the answer depends on what we mean by ‘better.’ If the objective is maximum historical P&L, Gold Mini wins. If the objective is profit generated per trade and risk efficiency, NIFTY looks more attractive.
But there is one major limitation
The two backtests do not cover exactly the same calendar period.
The NIFTY test starts around May 2010, while the Gold Mini test starts around March 2015. The end dates are also different.
That means the systems were exposed to different combinations of bull markets, bear markets, volatility regimes, monetary-policy environments, economic cycles, commodity cycles and market-structure changes.
Therefore, we cannot say with complete confidence that Gold is better simply because it generated more profit.
The cleanest comparison would be to run both instruments over the same calendar window, using the same strategy rules, equivalent position-sizing assumptions and realistic transaction costs.
The next step: compare capital efficiency
There is another layer that is even more important.
The current comparison shows NIFTY margin per lot at ₹2.10 lakh versus ₹1.65 lakh for Gold Mini. Against this, the historical maximum drawdowns were ₹83,740 versus ₹95,959.
So the next question should not simply be: ‘Which instrument made more money?’
It should be: ‘Which instrument gives me the best return for every rupee of capital that I have to deploy and risk?’
That requires normalizing the two systems for initial capital, margin requirement, maximum drawdown, lot size, contract value, transaction costs, brokerage, exchange charges, slippage, liquidity and position-sizing constraints.
Only after doing this can we make a proper capital-efficiency comparison.
Final conclusion
This comparison produced a much more interesting result than simply finding a winner.
Gold Mini generated more absolute profit, but NIFTY generated better profit per trade and showed stronger risk-efficiency characteristics.
Gold required almost twice as many trades to generate only moderately more total P&L. NIFTY, meanwhile, produced a higher expectancy, better reward-to-risk ratio, lower maximum drawdown and lower Ulcer Index.
At the same time, Gold had a higher win rate, slightly better Profit Factor and significantly shorter maximum drawdown duration.
So my conclusion from this backtest is not ‘NIFTY is better than Gold.’ Nor is it ‘Gold is better than NIFTY.’
The more accurate conclusion is: NIFTY appears to be the more efficient system, while Gold Mini appears to be the more active system.
And that distinction matters.
The next and more meaningful analysis is to normalize both strategies for capital deployed and risk per lot, and then determine which instrument provides the highest return on deployed capital while maintaining an acceptable drawdown.
That is ultimately the question that matters when deciding what to trade with real money.
Note: These are historical backtest results, not a guarantee of future performance. Backtests should also be validated with realistic costs, slippage and out-of-sample/forward testing before being used for live trading.