By adding-up the probabilities of all the outcomes that end-up with a streak
in a series of independent n red or green candles,
with the largest red-green streak (of length m).
Note: Very likely it is not intuitive to simply read the above in isolation.
Perhaps re-reading it after going through the n=1, n=2, …, n=3 calculations below, helps? 
Looking at a simple case - Instead of 12 years, a 'series' of just 1 week, i.e. a single candle (n=1)
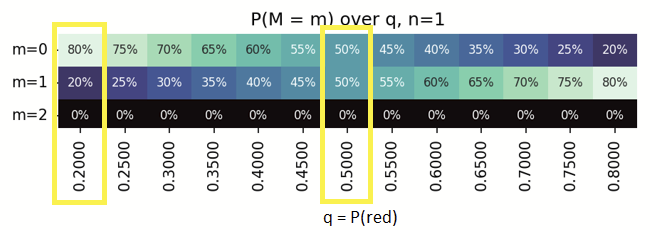
With a series of n=1, the possible outcomes are - either 1xGreen or 1xRed.
Looking at the column q=0.5,
- m=0 is streak of zero reds, Green (1/2) = 50%
- m=1 is streak of 1 red, Red (1/2) = 50%
- m=2 is impossible to have a run/streak of 2 reds in a series with 1 trial, 0%.
Similarly, looking at the column q=0.2,
- m=0 is streak of zero reds, Green (1 - 0.2) = 0.8 = 80%
- m=1 is streak of 1 red, Red (0.2) = 20%
- m=2 is impossible to have a run/streak of 2 reds in a series with 1 trial, 0%.
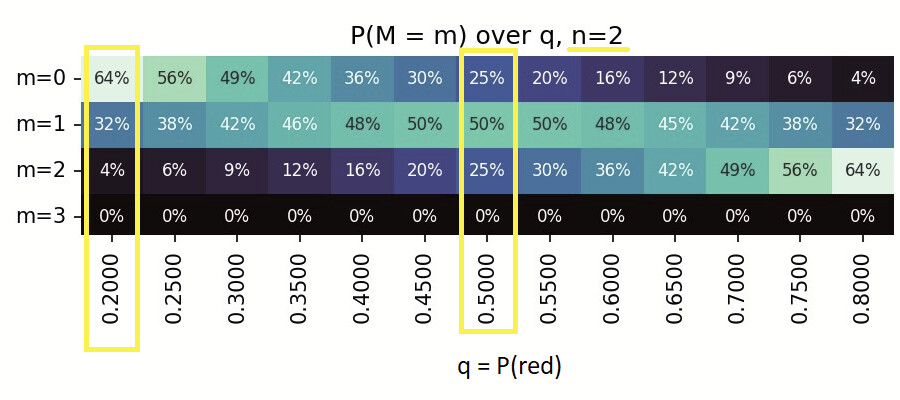
Extending this logic beyond 1 - a 'series' of 2 weeks, i.e. 2 candles (n=2)
With a series of n=2, the possible outcomes are - GreenGreen, GreenRed, RedGreen, RedRed.
Looking at the column q=0.5,
- m=0 is streak of zero reds, GreenGreen (1/4, 25%)
- m=1 is streak of 1 red, GreenRed+RedGreen (2/4, 50%)
- m=2 is streak of 2 reds, RedRed (1/4, 25%)
- m=3 is impossible to have a run/streak of 3 reds in a series with 2 trials, 0%.
Similarly, one can calculate the probabilities for biased (not 50-50%) probabilities as well.
with the same series of n=2,
the possible outcomes are still - GreenGreen, GreenRed, RedGreen, RedRed,
Looking at the column q=0.2,
however, we now have distinct probabilities (Green= 80%, Red = 20%).
- m=0 is streak of zero reds, GreenGreen - (0.8 x 0.8) = 0.64 = 64%
- m=1 is streak of 1 red, GreenRed+RedGreen - (0.8 x 0.2) + (0.2 x 0.8) = 0.32 = 32%
- m=2 is streak of 2 reds, RedRed - (0.2 x 0.2) = 0.04 = 4%
- m=3 is impossible to have a run/streak of 3 reds in a series with 2 trials, 0%.
Can still do the mental-math? - Here's a 'series' of 3 weeks, i.e. 3 candles (n=3)
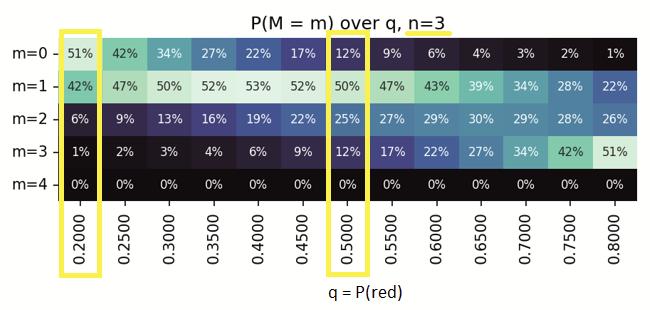
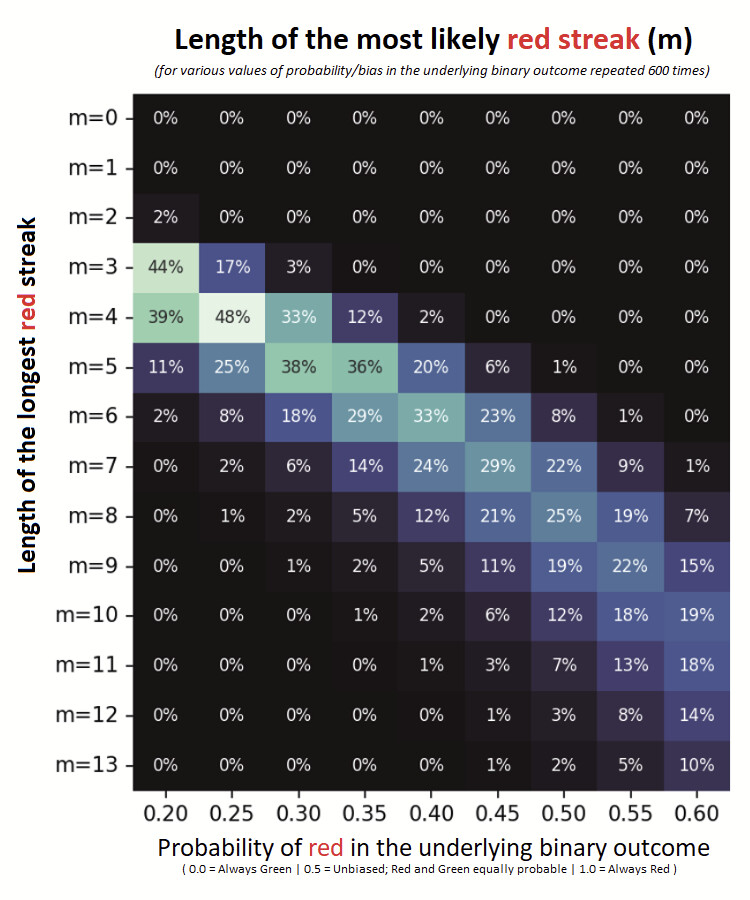
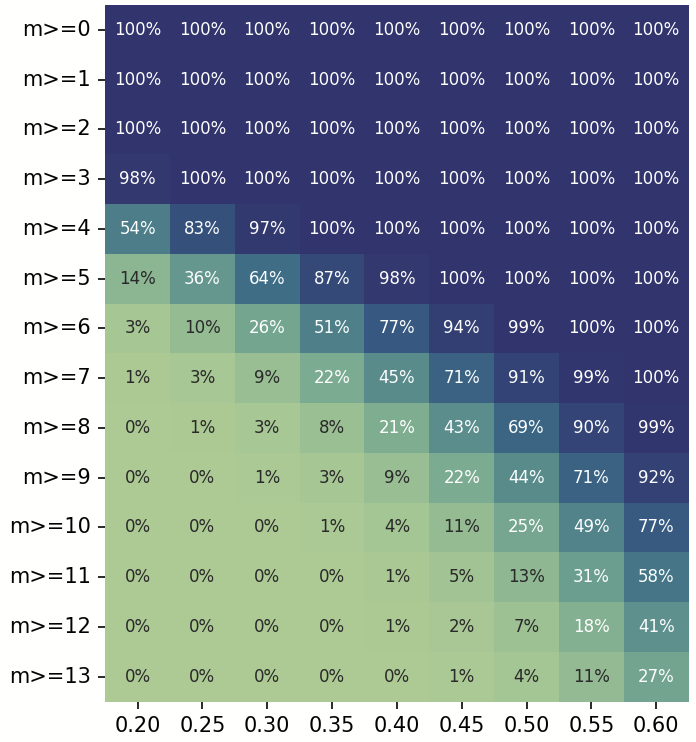
Extending this to a series of ~600 runs
(to arrive at the probabilities in the same ballpark as the number of weeks in 12 years),
we have the heatmap of probabilities of weekly red-streaks over 12 years.
Here’s the sample Python code to generate such a heatmap on the command-line.
heatmap_individual.py
"""Utilities to compute probabilities of runs in sequences of Bernoulli(q) trials.

Exposes:
- prob_no_run(n, r, q): P(no run of r consecutive successes within n trials)
- prob_exact_m_in_a_row(n, m, q): P(at least one run of exactly m and no run ≥ m+1)
"""

def prob_no_run(n: int, r: int, q: float) -> float:
     """Return P(no run of ``r`` consecutive successes in ``n`` Bernoulli(q) trials).

     Dynamic-programming model:
     - State ``dp[k]`` stores the probability that the current suffix of the
       processed prefix ends with exactly ``k`` consecutive successes (``k`` in
       ``0..r-1``) and that no run of length ``r`` has occurred so far.
     - On a success, the run length increases by 1 (shift right), but we cap at
       ``r-1`` by construction of the state space, which ensures we never count
       states that already contain a forbidden run.
     - On a failure, the run length resets to 0.
     The answer is the total probability mass over all allowable end states.
     """

     # Initialize all mass at run-length 0 before any trials
     dp = [0.0] * r
     dp[0] = 1.0

     for _ in range(n):
         # Next-step distribution over run-length states 0..r-1
         nxt = [0.0] * r

         # Success transitions: extend runs of length k to k+1 for k in [0, r-2]
         for k in range(r - 1):
             nxt[k + 1] += dp[k] * q

         # Failure transitions: any state collapses to run-length 0
         mass = sum(dp)
         nxt[0] += mass * (1 - q)

         dp = nxt

     # Sum over all non-forbidden end states
     return sum(dp)

def prob_exact_m_in_a_row(n: int, m: int, q: float) -> float:
     """Return P(at least one run of exactly ``m`` successes, and none of length ≥ ``m+1``).

     Uses the identity:
     P(no run ≥ m+1) − P(no run ≥ m) = P(at least one run of exactly m and no run ≥ m+1).

     Special case ``m == 0`` corresponds to no successes at all, i.e., ``(1−q)^n``.
     """
     if m == 0:
         # No run ≥ 1 means no successes at all
         return (1 - q) ** n

     # Subtract the probabilities of having no run of length ≥ m and ≥ m+1
     return prob_no_run(n, m + 1, q) - prob_no_run(n, m, q)


if __name__ == "__main__":
    import argparse
    # CLI to evaluate a single probability value for provided (n, m, q)
    parser = argparse.ArgumentParser(description="Probability of at least one run of exactly length m (and no run ≥ m+1) in n Bernoulli(q) trials. For m=0, this equals (1−q)^n (no successes at all).")
    parser.add_argument("-n", "--n", type=int, required=True, help="number of trials (n >= 0)")
    parser.add_argument("-m", "--m", type=int, required=True, help="run length m (m >= 0)")
    parser.add_argument("-q", "--q", type=float, required=True, help="success probability q in [0,1]")
    parser.add_argument("--precision", type=int, default=2, help="decimal places to print (default 2)")
    args = parser.parse_args()

    if args.n < 0:
        raise SystemExit("n must be >= 0")
    if args.m < 0:
        raise SystemExit("m must be >= 0")
    if not (0.0 <= args.q <= 1.0):
        raise SystemExit("q must be in [0, 1]")

    prob = prob_exact_m_in_a_row(args.n, args.m, args.q)
    print(f"{prob:.{args.precision}f}")
heatmap_table.py
"""Print a table of probabilities for runs of exactly length M across q values.

For each M in [0, m] and each q in [q_min, q_max] with step q_step, this CLI
prints P(at least one run of exactly length M and no run ≥ M+1) for n trials.
"""

import argparse
import sys
from typing import List, Optional, Sequence

from heatmap_individual import prob_exact_m_in_a_row


def generate_q_values(q_min: float, q_max: float, q_step: float) -> List[float]:
     """Return an inclusive list of q values from q_min to q_max with step q_step.

     - If q_step <= 0, raises ValueError.
     - If q_min > q_max, returns an empty list.
     - Each value is clamped into [0.0, 1.0].
     - Uses a small epsilon to ensure q_max is included despite FP accumulation.
     """
     if q_step <= 0:
         raise ValueError("q_step must be > 0")
     if q_min > q_max:
         return []

     values: List[float] = []
     epsilon = 1e-12  # Tolerance to include the upper bound
     current = q_min

     # Include q_max within tolerance of floating-point arithmetic
     while current <= q_max + epsilon:
         q = current if current <= q_max else q_max
         # Clamp to [0,1]
         q = max(0.0, min(1.0, q))
         values.append(q)
         current += q_step
     return values


def parse_args(argv: Optional[Sequence[str]] = None) -> argparse.Namespace:
    """Parse CLI arguments for the probability table generator."""
    parser = argparse.ArgumentParser(
        description=(
            "Print a table of probabilities of at least one run of exactly length M (no run ≥ M+1)\n"
            "Rows: M = 0..m; Columns: q from q_min..q_max in steps of q_step."
        )
    )
    parser.add_argument("-n", "--n", type=int, required=True, help="number of trials (n >= 0)")
    parser.add_argument("-m", "--m", type=int, required=True, help="max run length row index (m >= 0)")
    parser.add_argument("--q-min", type=float, default=0.1, help="min q (default 0.1)")
    parser.add_argument("--q-max", type=float, default=0.8, help="max q (default 0.8)")
    parser.add_argument("--q-step", type=float, default=0.05, help="step for q (default 0.05)")
    parser.add_argument("--precision", type=int, default=4, help="decimal places to print (default 4)")
    parser.add_argument("--sep", type=str, default="\t", help="column separator (default TAB)")
    return parser.parse_args(argv)


def validate_args(args: argparse.Namespace) -> None:
    """Validate parsed arguments; raise ValueError with a helpful message if invalid."""
    if args.n < 0:
        raise ValueError("n must be >= 0")
    if args.m < 0:
        raise ValueError("m must be >= 0")
    if not (0.0 <= args.q_min <= 1.0 and 0.0 <= args.q_max <= 1.0):
        raise ValueError("q_min and q_max must be in [0, 1]")
    if args.q_step <= 0:
        raise ValueError("q_step must be > 0")


def print_probability_table(
    n: int,
    m: int,
    q_values: List[float],
    precision: int,
    sep: str,
) -> None:
    """Print the probability table.

    - The header row lists q values.
    - Each subsequent row corresponds to a run length M in [0, m].
    """
    row_label_width = max(4, len(str(m)))

    header_cells = [" " * row_label_width] + [f"{q:.{precision}f}" for q in q_values]
    print(sep.join(header_cells))

    separator_row = ["-" * row_label_width] + ["-" * len(h) for h in header_cells[1:]]
    print(sep.join(separator_row))

    for run_length_m in range(0, m + 1):
        row_cells = [str(run_length_m).rjust(row_label_width)]
        for q in q_values:
            probability = prob_exact_m_in_a_row(n, run_length_m, q)
            row_cells.append(f"{probability:.{precision}f}")
        print(sep.join(row_cells))


def main(argv: Optional[Sequence[str]] = None) -> int:
    """Program entry point.

    Parses arguments, validates them, generates q values, and prints the table.
    Returns a process exit code (0 for success).
    """
    try:
        args = parse_args(argv)
        validate_args(args)
        q_values = generate_q_values(args.q_min, args.q_max, args.q_step)
        if not q_values:
            raise ValueError("Empty q range; ensure q_min <= q_max")
        print_probability_table(
            n=args.n,
            m=args.m,
            q_values=q_values,
            precision=args.precision,
            sep=args.sep,
        )
        return 0
    except ValueError as exc:
        print(str(exc), file=sys.stderr)
        return 2


if __name__ == "__main__":
    raise SystemExit(main())
NOTE: The above code snippets were generated using LLM assistance.
Subsequently manually reviewed, and output sanity-checked for small sample-sizes.
(probably the weakest link in this entire chain of thought? )
No simulation. Computing each of them as seen above.
While i originally did it intuitively, apparently the formal keyword for it is an I.I.D. - Bernoulli trial.
(something i found out as part of trying to explain this today. Thanks for the review  )
)