Many people are terrified right now. Stock markets were on a dream run after dropping as much as 40% in March 2020. Whatever you picked seemed to be going up. Things haven’t been the same since the beginning of 2022. Nifty and Sensex are down by over 14% from the highs of October 2021, and the drawdowns are even more if you look at stocks individually.
This has changed the mood from euphoric to pessimistic. Some people are even panicked.
But there is no reason to. While for the people who started investing after March 2020, this is the first correction they are witnessing. But those who have spent time in the markets know very well that markets always go through cycles of correction. This isn’t the first time it is happening and won’t be the last.
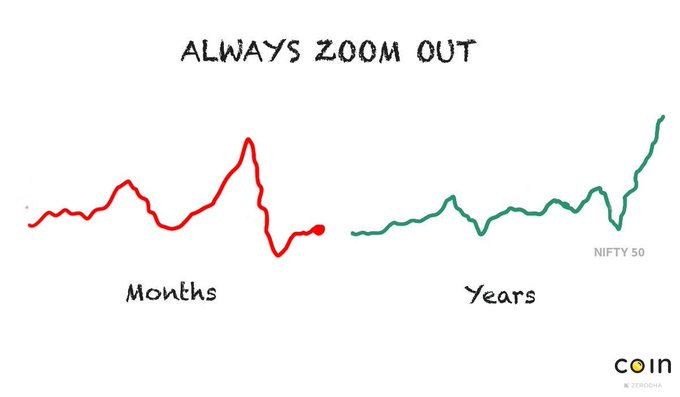
Though it’s easier said than done but there’s nothing to panic about. Just have a look at the below chart. In the short run, markets have suffered big corrections due to one event or the other but in the longer run, they have always managed to climb the wall of worries.
Your journey in stock markets isn’t going to be smooth sailing. There are going to be many speed bumps along the way which you have to endure bravely. While it looks easy, but stock markets are the hardest place to make money.
Markets aren’t just about generating returns. If you’re investing in the right assets, in the longer run you will eventually get there but in the shorter run what matters is being strong mentally, If you are not, then it doesn’t matter if you are the best stock picker, you are always going to get easily swayed by short-term volatility and will never manage to achieve the end goal.
As Morgan Housel put it: Volatility is price of admission. The prize inside are superior longterm returns. You have to pay the price to get the returns. Many aren’t.
When markets are down there’s not much you can do other than remain resilient, avoid panic and making rash decisions. What is painful in the short run is a building block for a better future.
20 Likes
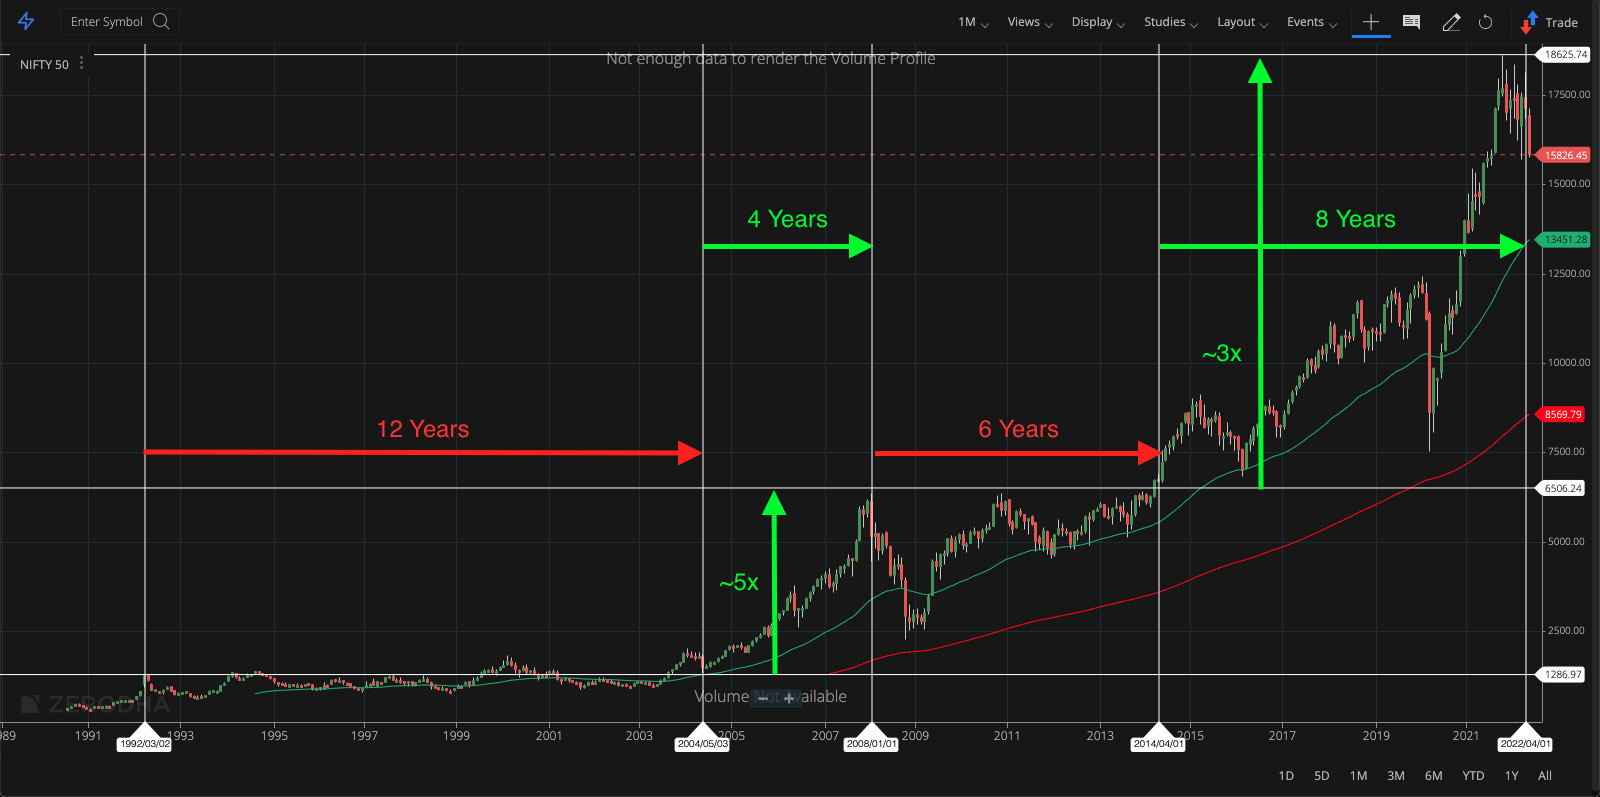
Nice historical event calendar. And the title did catch my attention. While what is said in the article looks broadly right, it is incomplete without giving due weightage and a proper context of the most important element herein - the X-Axis which is Time. Terms like “short run”, “longer run”, “better future”, “zoom out” are meaningless without the perspective of time. The article is concluding by saying - “always zoom out” but the article content only talks about past 2 years. So I took the liberty of having a chart that zooms out 30 years and gives due weightage to time -
- This red arrows herein represent the time elapsed from a bull run peak to the time until the peak was convincingly breached.
- The horizontal green arrows represent the time elapsed from the time when the previous peak was breached till the next bull run peak.
- The vertical green arrows represent index returns from the time when the previous peak was breached till the next bull run peak was reached.
One will observe that -
- It took 12 years for the the Harshad Mehta bull run peak in 1992 to be convincingly breached.
- It took 6 years for the 2008 bull run peak to be convincingly breached.
- We had a 4 years bull run once Harshad Mehta bull run peak was convincingly breached in 2004 during which the market gave approximately 5x returns.
- We had a 8 years bull run once 2008 bull run peak was convincingly breached in 2014 during which the market gave approximately 3x returns.
So, we have -
Stagnant Market Cycle - 12 years, 6 years, (3 years maybe) …
Bull Run Market Cycle - 4 years, 8 years, (16 years maybe) …
Bull Run Returns Market Cycle - 5x, 3x, (1x maybe) …
One cannot deny the eerie cyclical nature of things and if this technical analysis is any projection (which TA is certainly not) it will be as follows (for stagnant market, bull run and bull run returns multiple) -
- We are going to have another 3 years, i.e. until 2025, 18600 will not be convincingly breached on NIFTY and no returns on index until then.
- We are going to have the next 16 years, i.e. from 2025 till 2041 when the market is expected to give only 1x returns which is a CAGR of 4.43% which incidentally is the current repo rate as well (4.4%)
Anyhow, of-course this is all conjecture and I am no Oracle and broadly one should surely not panic. But I will say this - if you are going to panic - “panic early” else be ready to spend the time in the stagnant market as represented historically in the chart. Again “early” is in context of the stagnant market duration and its projection (3 years).
Disclaimer: I am not trying to make any claim about where we are in the cycle or where we are heading. This is all conjecture and should not be treated as investment advice. But for a person entering in 1992 bull run peak, it took him 12 years to be back at the same level. Even Rakesh Jhunjhunwala’s net-worth from 1992 to 2002 changed from 200 cr to 250 cr only (if memory serves me right). I am just throwing in a perspective of what exactly is meant by being patient and the phrase “spending time in the market” … Its unit is years and usually measured in lot of years.
9 Likes