The June 2026 edition of NSE Market Pulse covers data from May 2026, the second month of FY27. Last month’s post covered April data. This one is about May.
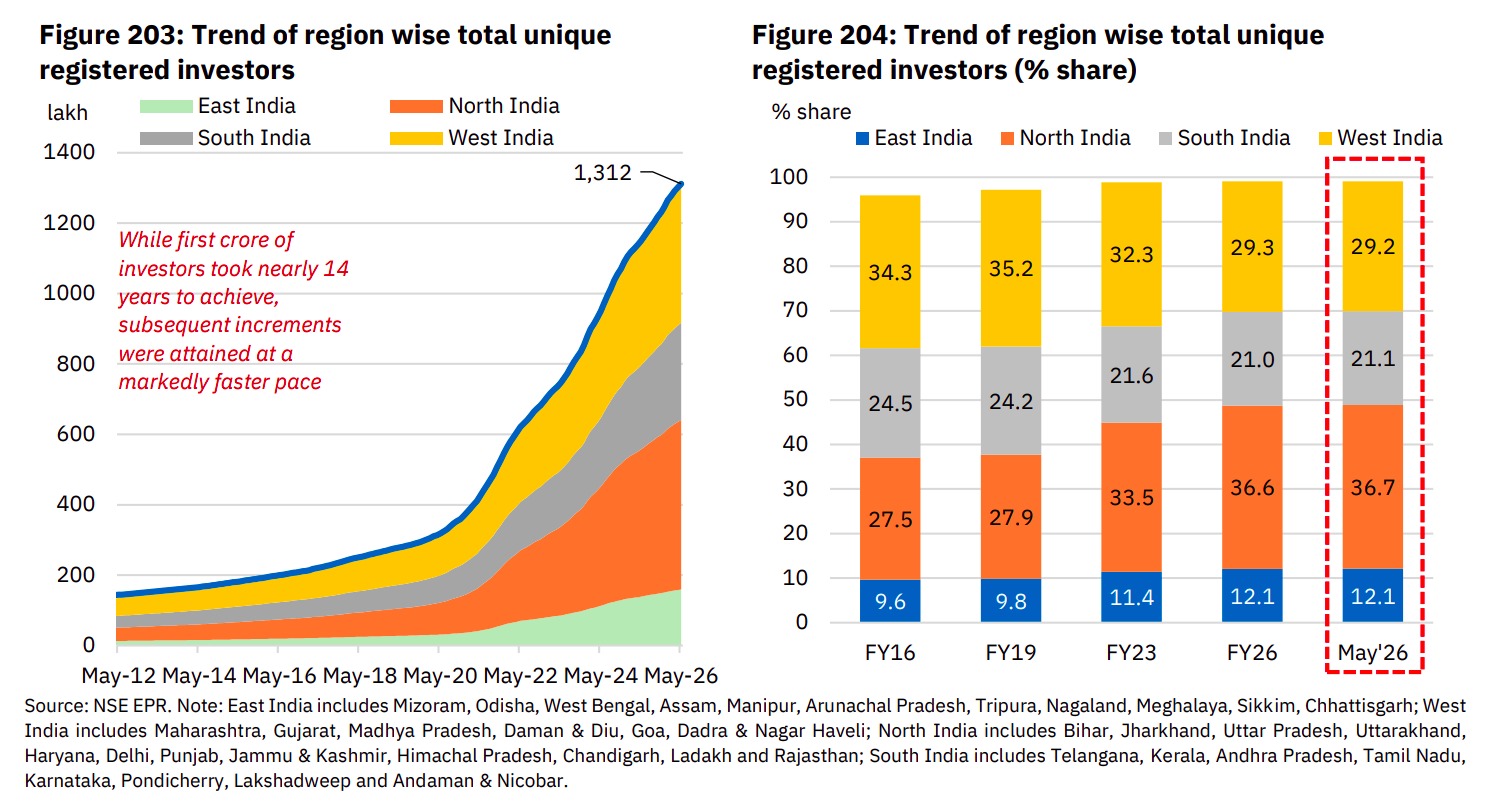
Investor Base around 13.1 Crore
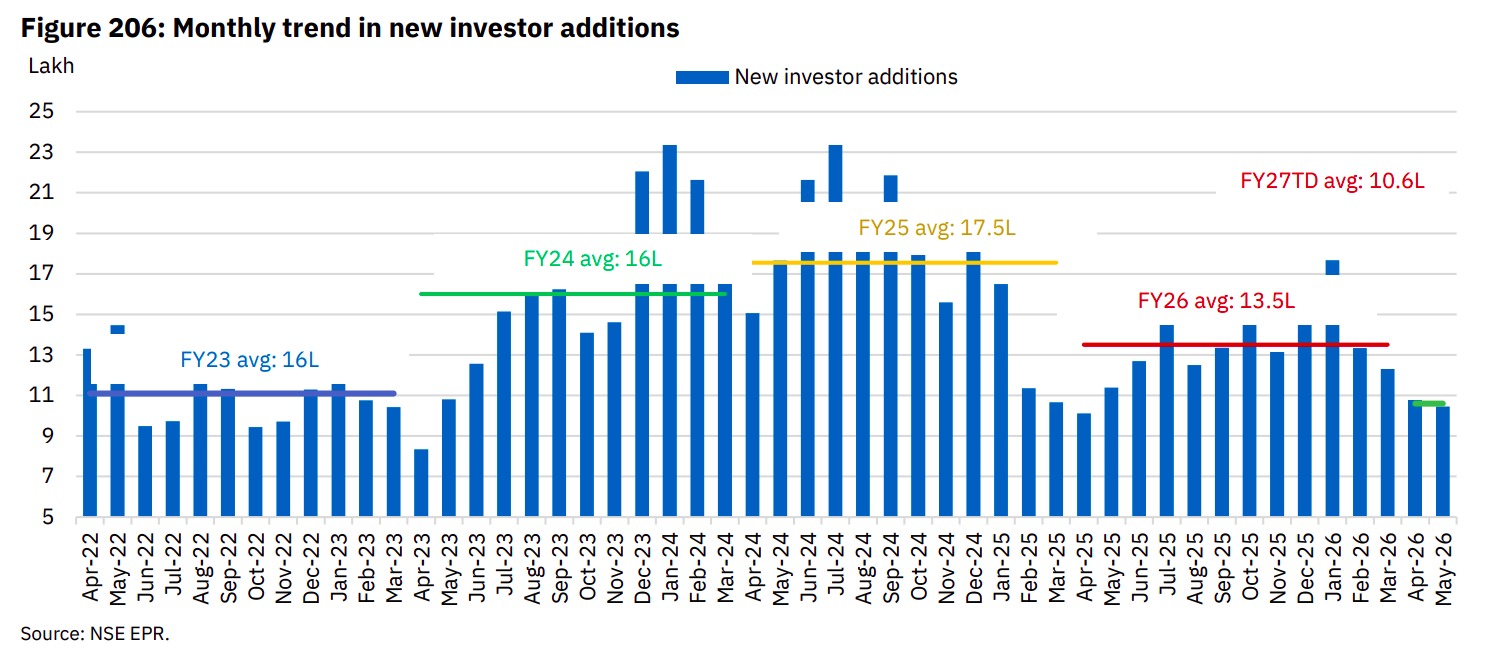
10.5 lakh new investors signed up in May, down 2.5% from April and 8.2% from a year ago. The monthly average in FY26 was 13.5 lakh, and in FY25 it was 17.5 lakh. The total registered base is now 13.1 crore. The good news is the decline seems to be leveling off. May had the smallest sequential drop in a year.
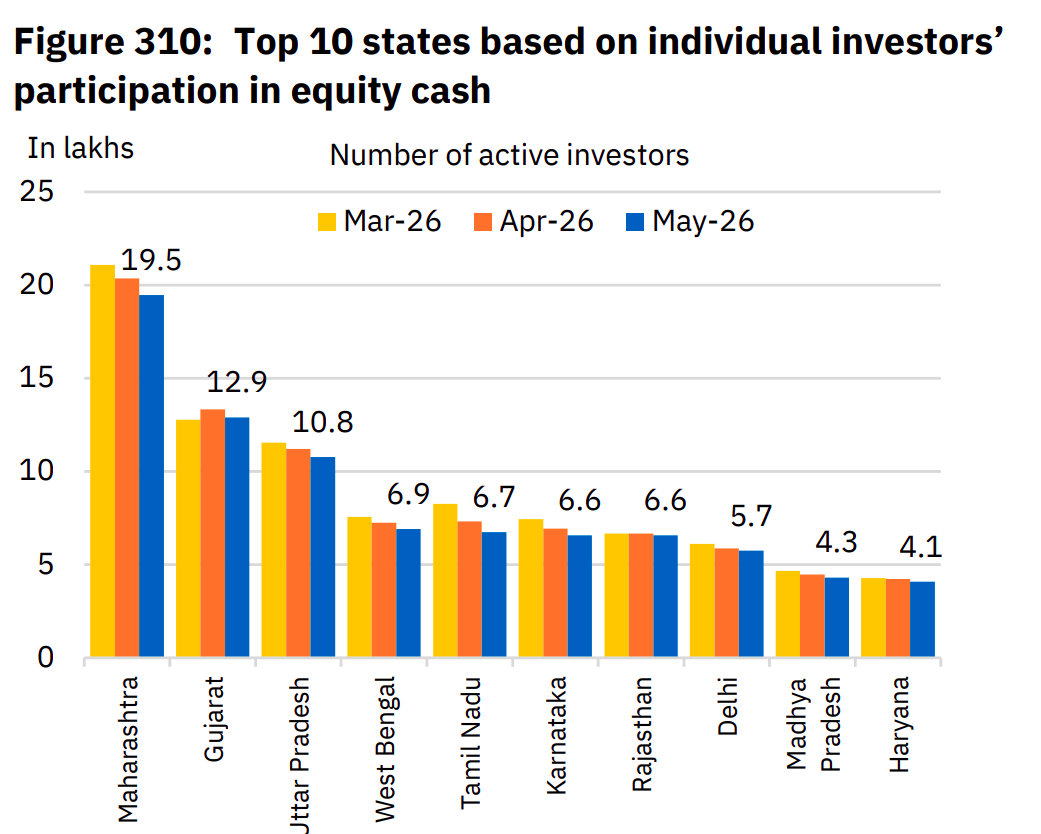
North of India leads regionally at 36.7% of the base with 4.8 crore investors. Maharashtra is still the only state above 2 crore. Bihar has grown its investor base 16 times since FY17, Mizoram 27 times, and Arunachal Pradesh 23 times.
New Registrations in May 2026
UP continues to dominate new additions at 16.1% of all registrations, or 1.7 lakh new investors in the month. Maharashtra was second at 1.1 lakh. Together, the top five states, UP, Maharashtra, West Bengal, Bihar, and Tamil Nadu, made up 46% of all new registrations.
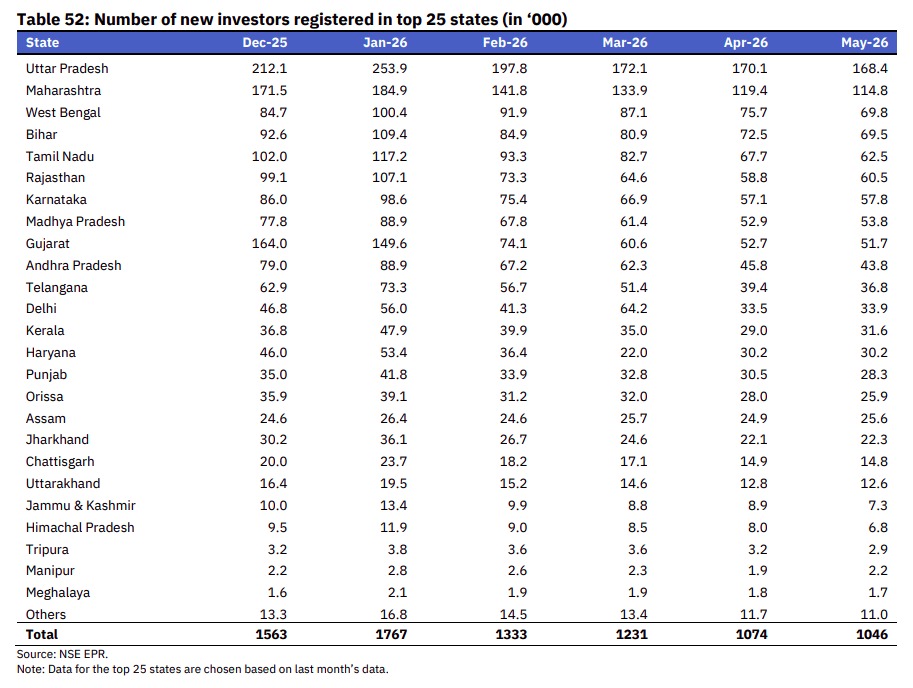
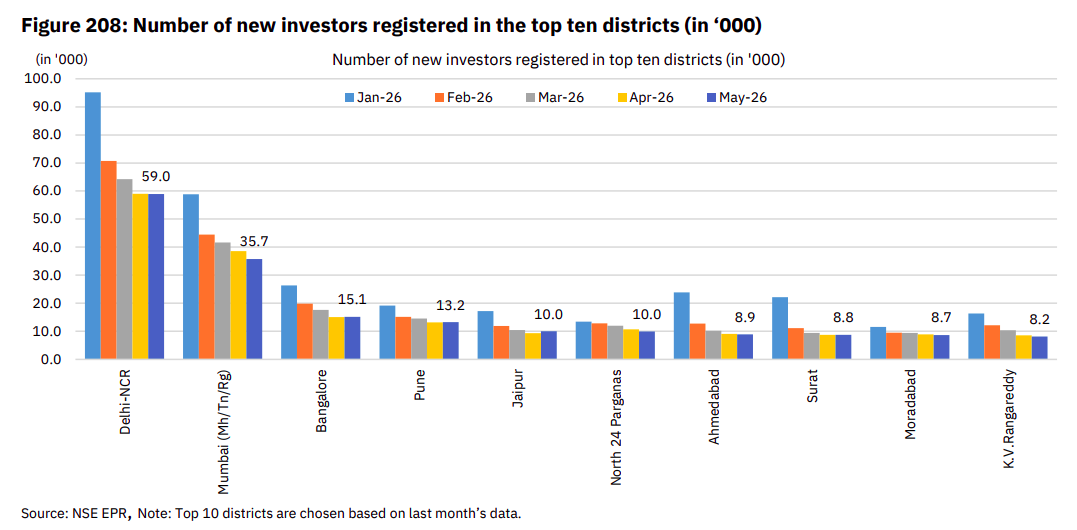
Mumbai saw the sharpest year-on-year fall among top districts at 18.6%. Delhi-NCR is still the number one district for new additions with a 5.6% share, but Jaipur was the only top 10 district that actually grew sequentially in May.
Investor profile
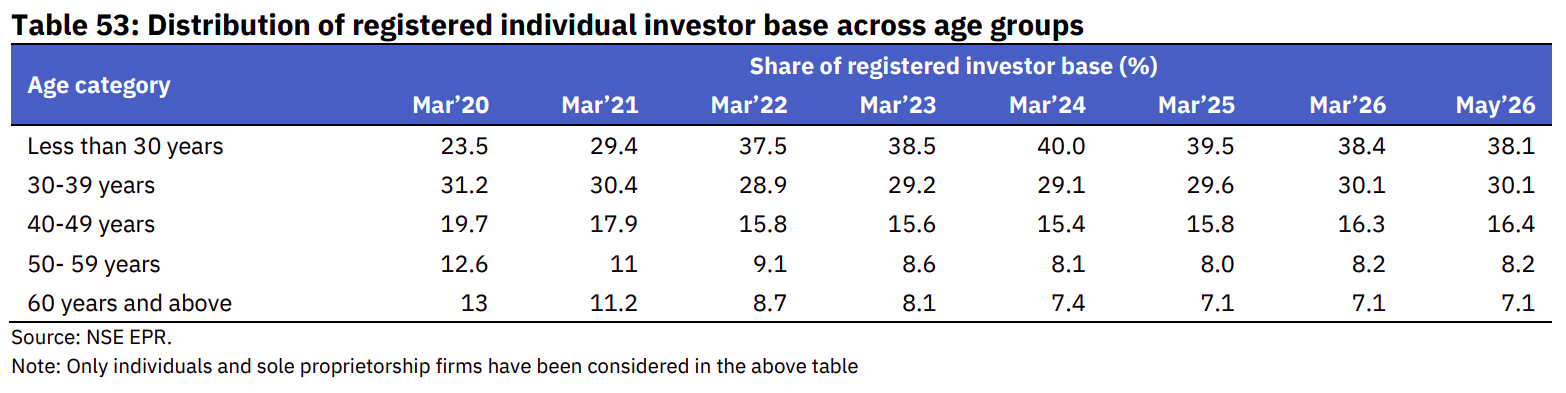
Nearly 6 in 10 new investors in FY27 so far are under 30 years old. The median age of new registrations is 27. The overall base has a median age of 33, down from 38 in 2020.
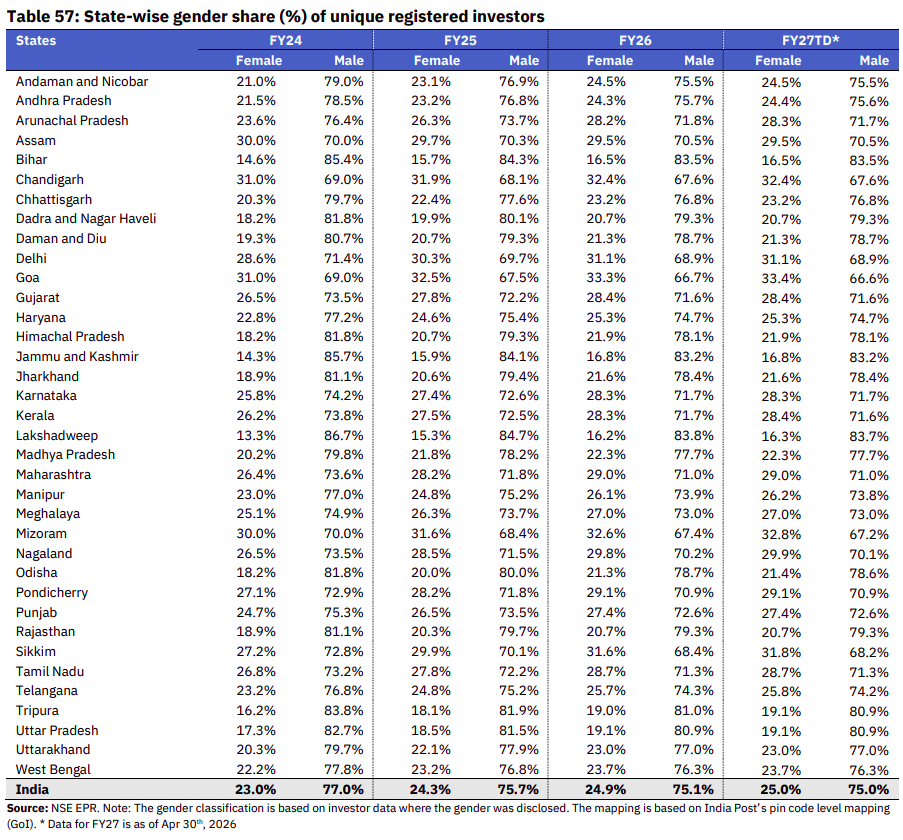
Women are at 25% of all individual investors nationally. Maharashtra leads the big states at 29%, Tamil Nadu at 28.7%. UP, despite being the second-largest state by population, has only 19.1% female participation, well below the national average.
Market Activity in May 2026
Cash market average daily turnover hit Rs 1.41 lakh crore, up 5% MoM, the highest in nearly two years and the third straight monthly increase. Average trade size was Rs 35,800.
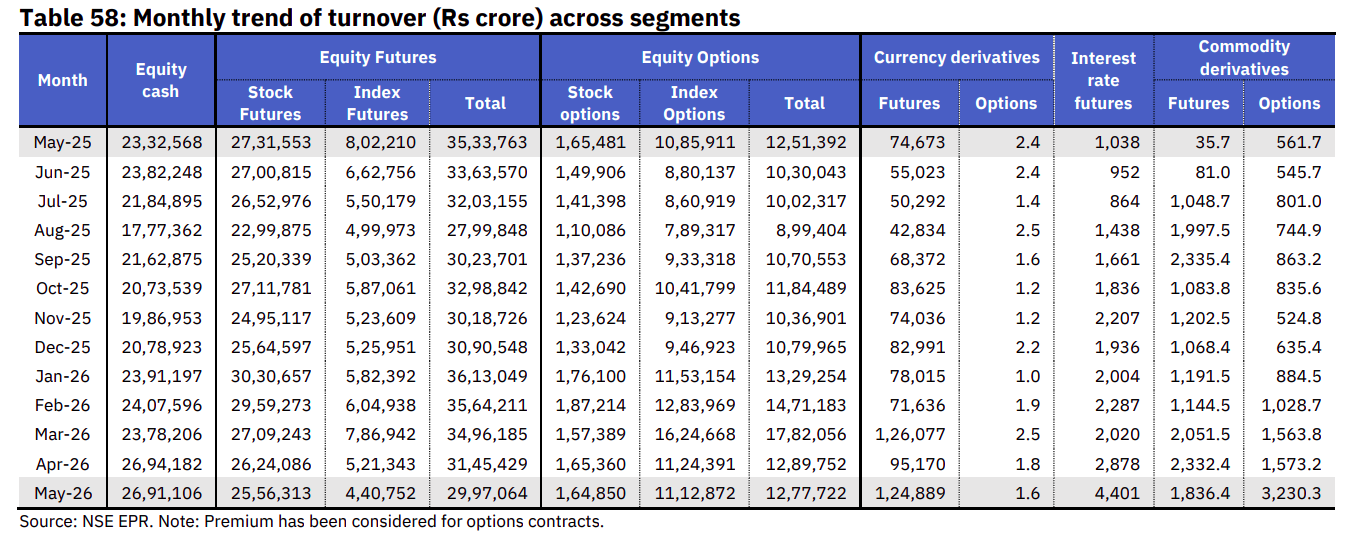
Index futures ADT fell 11% MoM and 39% year on year to Rs 23,197 crore. Stock futures were up 2.5% to Rs 1,34,543 crore. Index options premium ADT rose 4.2% to Rs 58,572 crore. Stock options up 4.9% to Rs 8,676 crore.

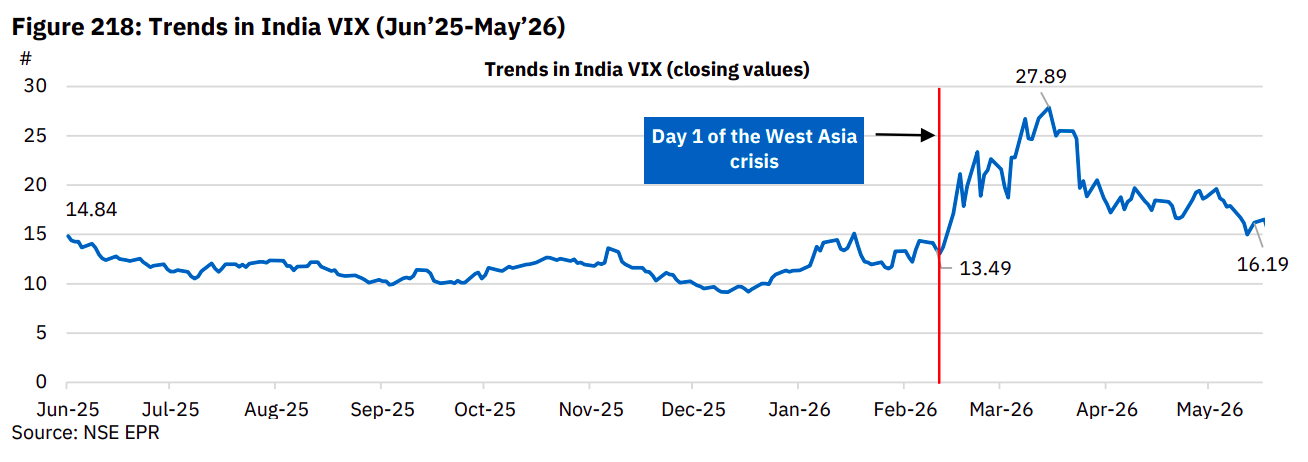
India VIX eased from 22 in March to 18 in May.
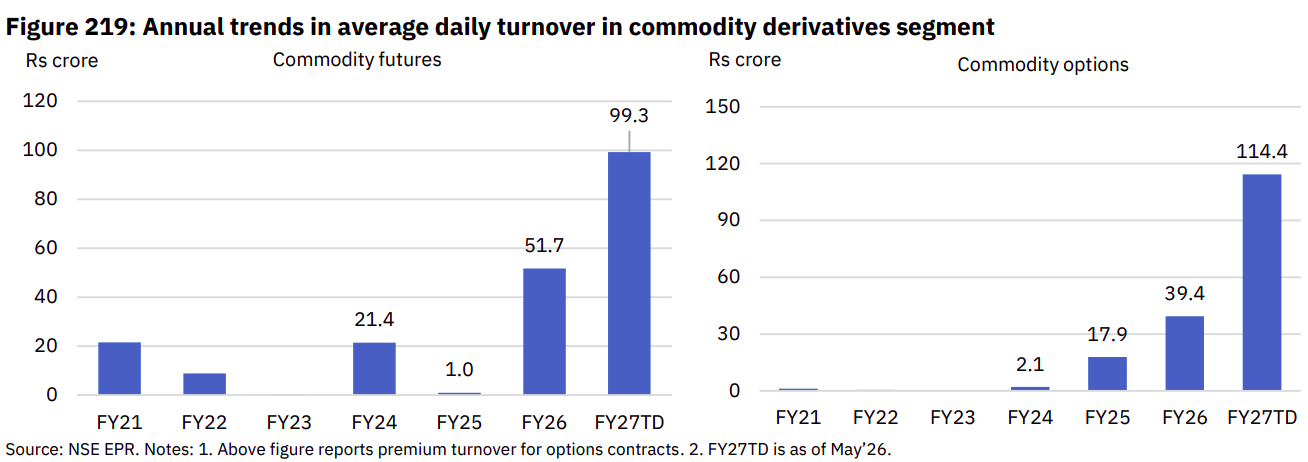
Currency futures ADT jumped 31% MoM to Rs 6,573 crore. Interest rate futures hit Rs 232 crore ADT, up 53% MoM and the highest in five years. Commodity futures ADT fell 21% to Rs 87 crore.
Commodity options ADT more than doubled to Rs 154 crore, an all-time high, driven almost entirely by crude oil options.
Category-wise Participation
Cash market: prop traders at 34.3%, individuals at 32.8%, foreign investors up 231 bps MoM to 14.2%, DIIs at 11.9%.
Equity futures: foreign investors reached 31.3%, an all-time high. They were at 15.5% a year ago. Prop traders fell to 27.9%.
Stock options are a completely different story. Prop traders dominate at 64% of stock options turnover. Individuals are at 25.9%. This is very different from index options, where prop is 46.8%, and individuals are 40.5%. The two option segments have completely different participant structures.
Currency options have seen an extreme shift. Individual investors now hold 67.5% of currency options turnover, up from 36.6% a year ago. Prop traders have effectively exited, down from 15.5% to nearly zero.
Commodity futures: individual investors hit an all-time high of 32.6%. Prop traders fell to an all-time low of 48.7%. A year ago, retail was barely present in this segment.
Interest rate futures: prop traders held over two-thirds of turnover. Corporate participation fell to 26.5%, a four-year low.
Individual Investors
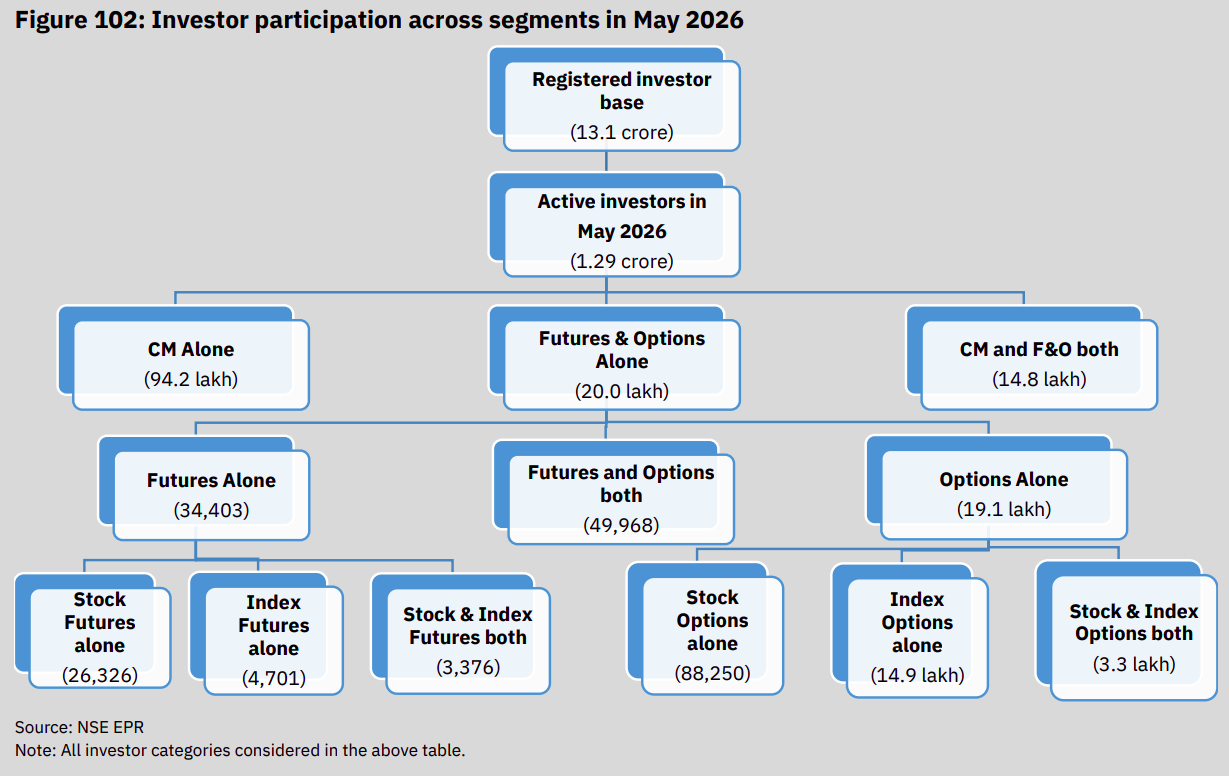
Individuals were net buyers for the third straight month at Rs 3,011 crore. Cumulative FY27 net inflows stand at Rs 24,582 crore. Active investors in cash fell to 1.08 crore and F&O to 34.6 lakh, fifth consecutive monthly decline. Of 13.1 crore registered investors, only 1.29 crore traded even once in May. 94.2 lakh were cash only, 34,403 purely in futures, and 14.9 lakh only in index options.
FPIs pulled out US$ 29.2 billion cumulatively since March 2026 as of June 12. DIIs absorbed most of it with Rs 82,669 crore in net purchases in May alone.
Turnover is concentrated
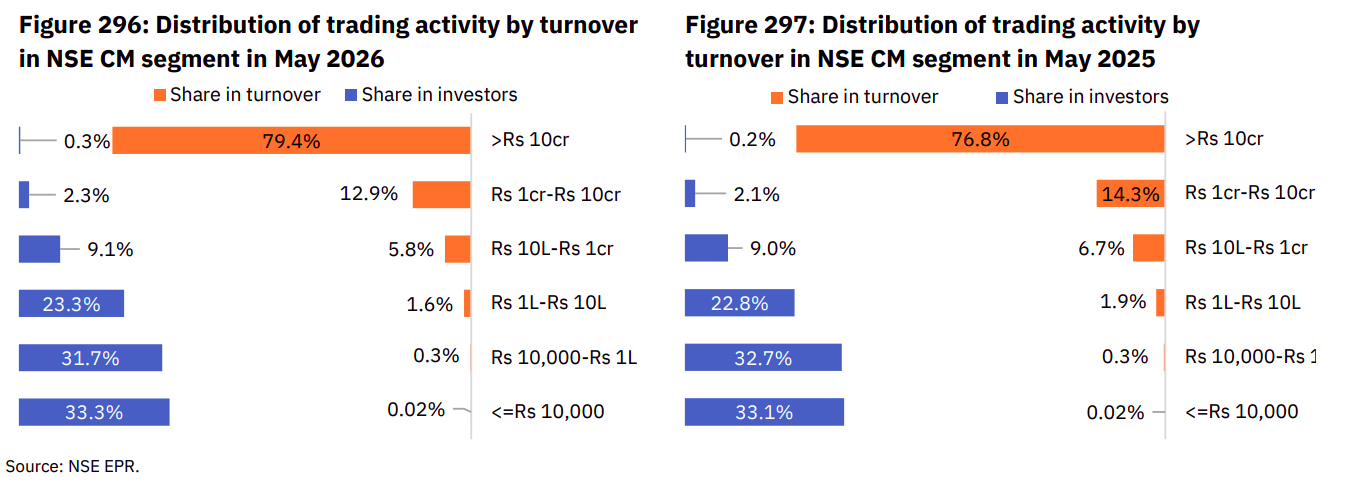
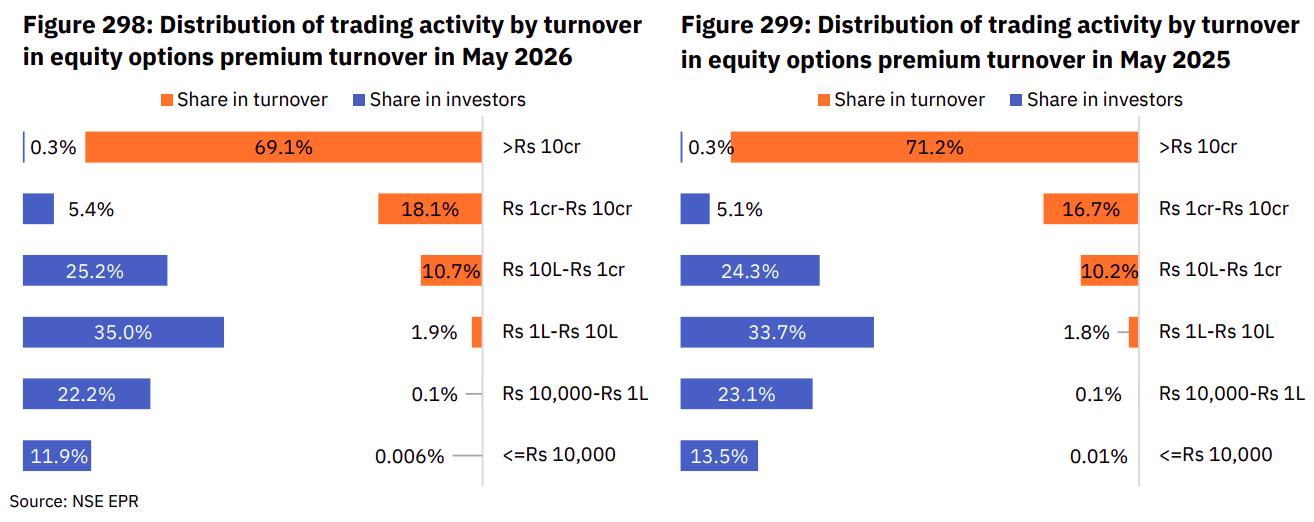
92.3% of cash market turnover came from 2.6% of active investors in May, higher than 91.1% a year ago. Equity futures was more skewed, top 7.8% drove 93.3% of turnover. In options, 5.7% of active investors trading above Rs 1 crore in premium contributed 87.3% of total premium turnover.
Within that top equity futures cohort, prop traders led at 34.7% but foreign investors were right behind at 30.9%, up sharply from a year ago.
Distribution of Individual Investor Activity
Individual investor cash market turnover was Rs 17.7 lakh crore in May, down 3.1% MoM. West India leads at Rs 5.8 lakh crore (32.9% share) but has been losing share for four years. North India at Rs 5.6 lakh crore (31.7%), South at Rs 4.4 lakh crore (24.9%).
Maharashtra led states at Rs 3.3 lakh crore, Gujarat at Rs 1.9 lakh crore. Top five states accounted for 50.2% of individual investor turnover.
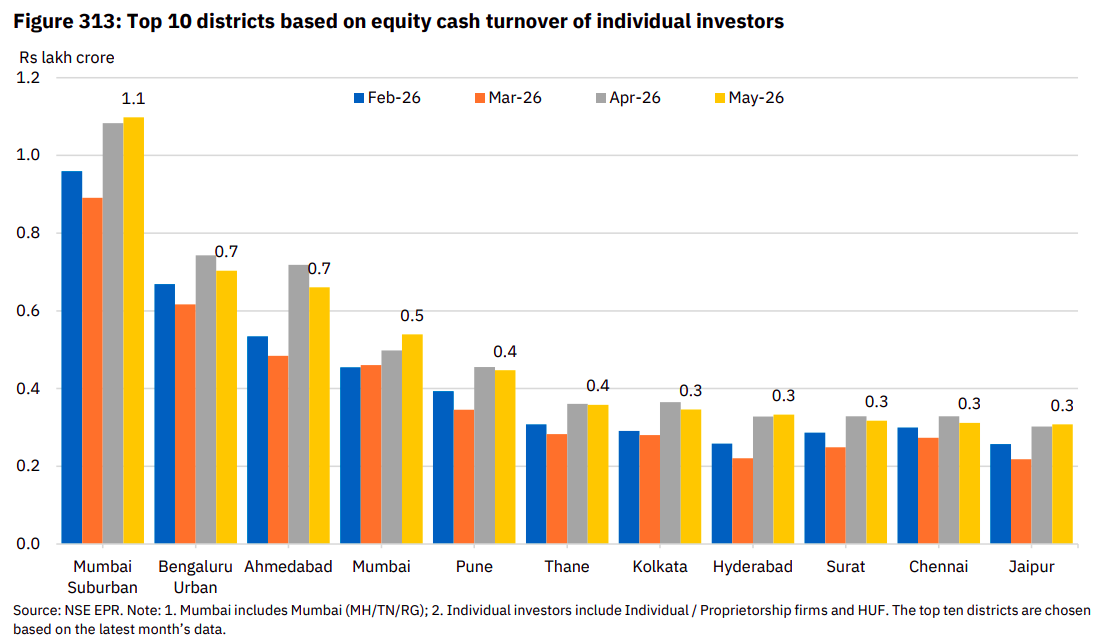
Mumbai Suburban was the top district at Rs 1.1 lakh crore. Bengaluru Urban second at Rs 70,000 crore. Active investors across the top 10 districts fell below 25 lakh for the first time since August 2025.
Trading Channels
Mobile share in index options hit 31% in May, an all-time high. Commodity derivatives mobile hit 33.7%, also an all-time high, up 28% points year on year. Desktop terminals lost a third of their commodity derivatives share in one year.
Colocation reached a record 43.4% of cash market turnover for FY27 so far. DMA moved up to 4.7% in May, a nine-month high, in line with the rise in foreign investor activity.
Mutual Fund Industry at Record AUM
Mutual fund average AUM hit a record Rs 83.5 lakh crore in May, up 1.9% MoM and 15.6% YoY. Gold ETF AUM also at a record Rs 1.8 lakh crore, 12% of total passive fund assets. Equity index fund and ETF inflows were Rs 9,500 crore, about half of April.

Corporate Bond Market
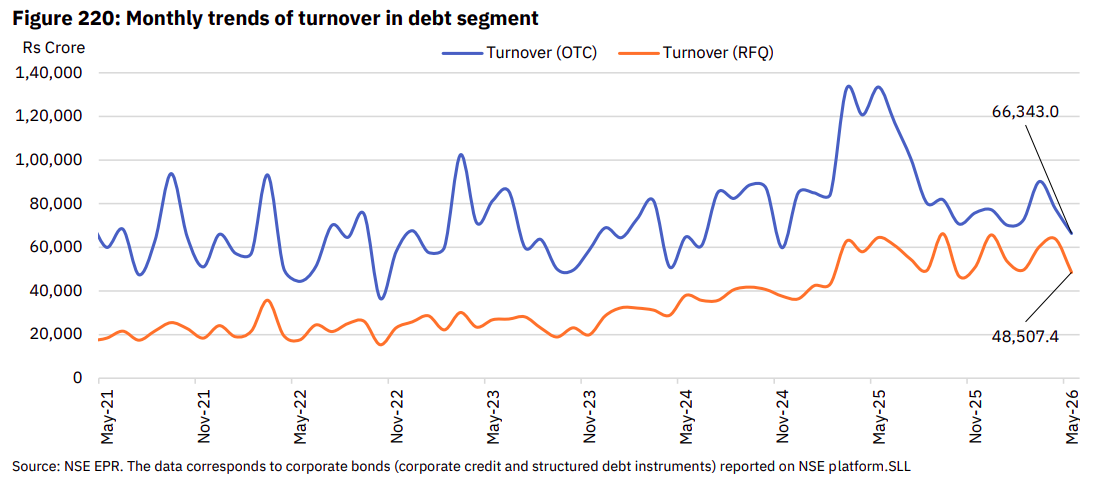
OTC turnover fell 14.5% MoM to Rs 66,343 crore. RFQ fell 24% to Rs 48,507 crore. Combined ADT came down to Rs 6,045 crore from Rs 7,440 crore in April.
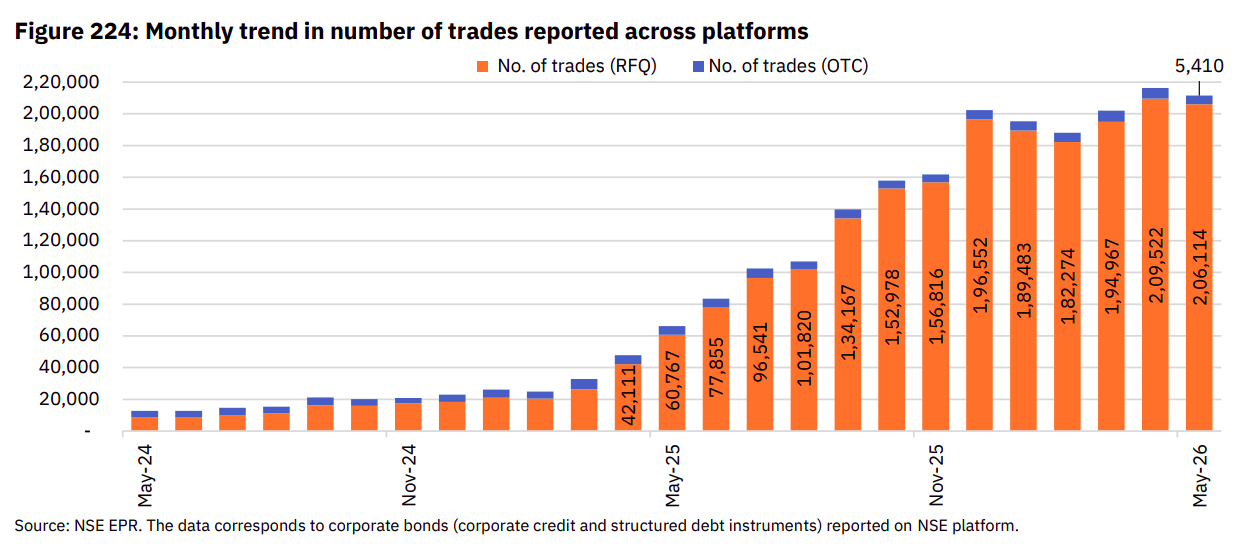
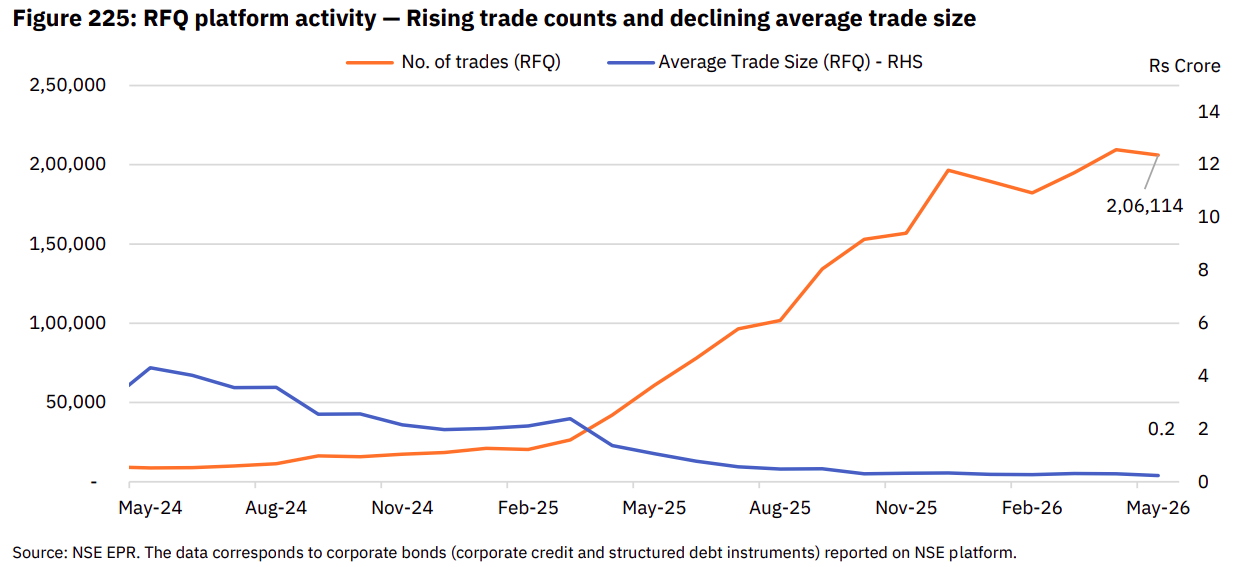
RFQ now accounts for 97.4% of all trades but only 42.2% of turnover. Average RFQ trade size hit a new all-time low of Rs 0.24 crore. OTC average trade size was Rs 12.3 crore. RFQ’s share of cumulative FY27 turnover is 43.8%, up from 32.5% at this point last year.
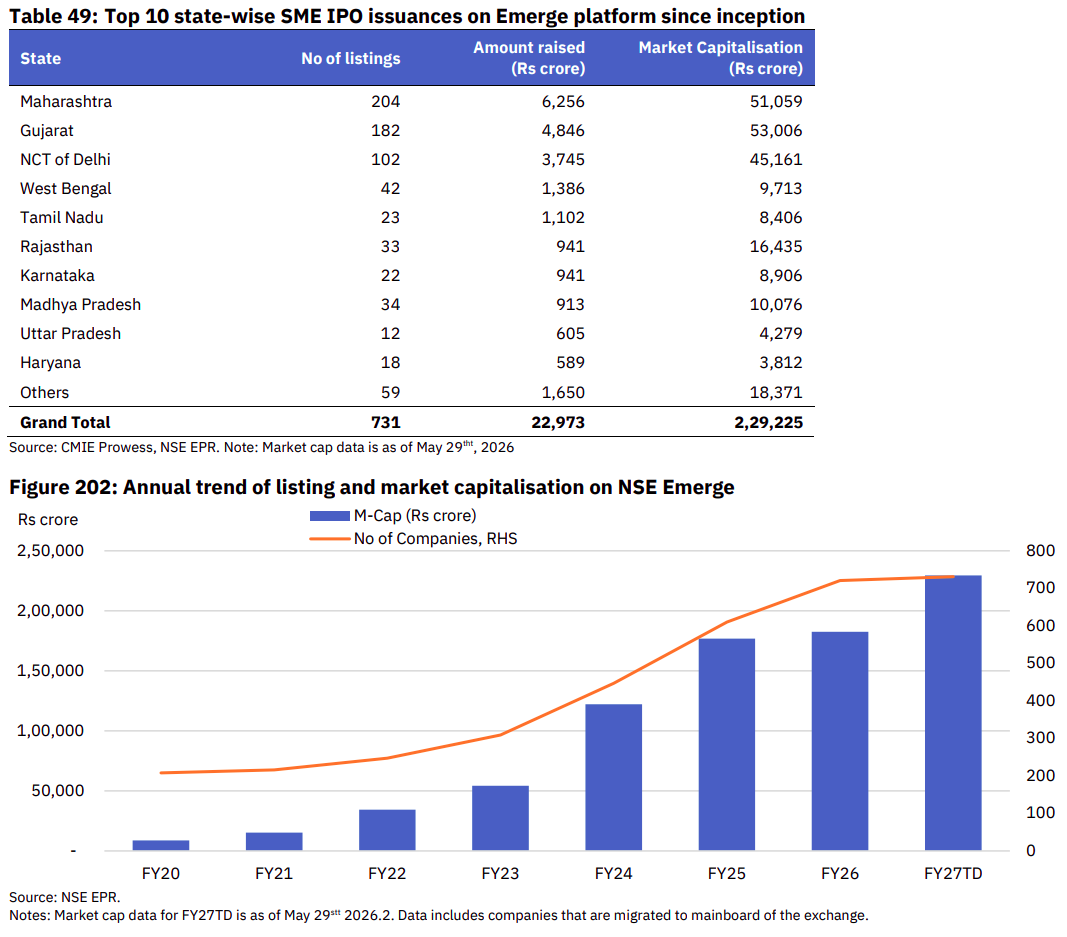
NSE Emerge Crosses 730 Listings
NSE Emerge crossed 731 listings as of May 2026, with a combined market cap of Rs 2.3 lakh crore and Rs 22,970 crore raised since inception. 160 companies have moved to the Mainboard. Maharashtra leads with 204 listings, Gujarat second at 182.