I am confused about the open interest data of options. In CNBC often the anchor says like there are addition of 5 lac shares NIFTY 10600 PUT, so it will act as resistance as people have bought put assuming NIFTY will not cross 10600 in near term.
My confusion is for the above 5 lac PUT Buyer, exactly 5 lac PUT Sellers are also there, who wants NIFTY to cross 10600, so that PUT premium goes down and they will earn profit.
SO, how to read this open interest data, as for every option seller there is a buyer too and vice versa, so open interest change means both side positions are taken by parties. So, how can we say the formula that - Price rise + OI Increase means Stock is bullish? Because a change in OI means both a bullish and bearish position is being made by 2 different persons.
i am also new to this but based on what i understand the Option Writer are Big boys of stock market and the trend is decided by them ,so if Put writers are seen at 10600 means they would make sure market does not fall below 10600 and same is case if we have high OI on call side suppose 10700 means they are sure market will no cross 10700 else they would make loss .Experst on group can give a better explanation and correct if i am wrong
I understood that 10600 PUT Writers do not want to let market fall below that level. Say there are 1000 of them who wrote those PUTS, so exactly 1000 Buyers are also there who wants to take market below that level, right? So, No. of PUT Writer = No. of PUT Buyer. So, how can we decide the direction from data?
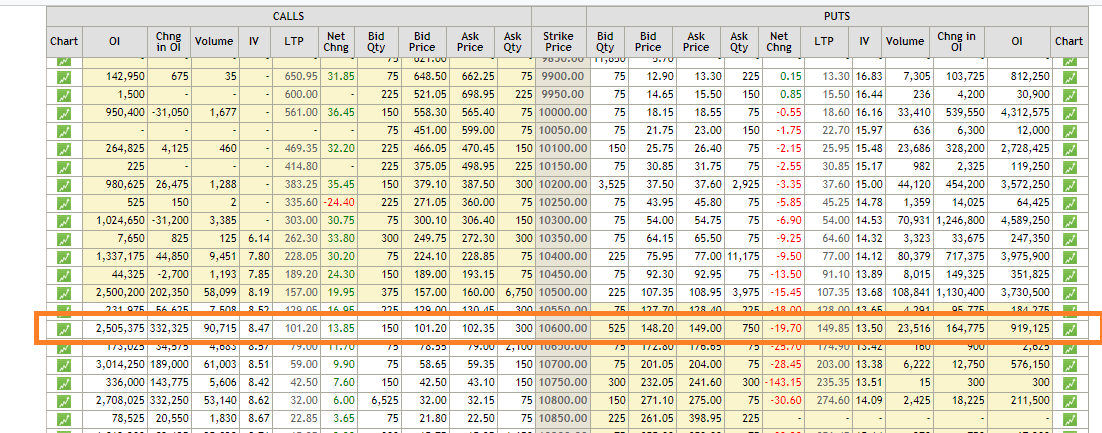
You need to analyze both CALL/PUT OI , refer screen shot, in case of Nifty 10600 PE change in OI is more than 1.5 lkh while premium dropped , means 10600 puts are written / shorted, where as 10600 CE OI addition is double the size of 10600 PE with increase in call premium means long addition , so longs are more than shorts + under line Nifty index closed in positive territory , in other words More upside expected on Nifty
I would like to suggest you that , don’t go by what CNBC anchor or any other media anchor says , study yourself
friend,
just looking at open interest we can’t conclude to get the direction,
we should see heavy players are which side
as 100 trader make 500 contracts can be taken as 5 contracts per trader
10 trader make 500 contracts can be as 50 contracts per trader
obviously 10 are heavy, as they have a large some of money in the market.
when they have large amount they must be ready for stopping market to move against, with the help of large buying or selling
That’s true. Suppose somebody sold 500 contracts and some 50 buyer bought it, 10 each. Then the seller is the big player and more power to prevent market go against him. Maybe he can sell more. But can we identify these scenario from OI data?
fii data, as total turnover of derivative market only fii account for more than 20%,
it shows they come with a large sum of money, their data is regularly displayed in nse, we have to figure out the things in that, which can clear us the image, below is the topic where their analysed data is displayed end of the day
You said they would make sure market does not fall below …but what can they do to make sure that it does not fall below…is it in their control ?
Give me an example/s of what they can do to defend their position