Where can I find chart/data of the historical prices of call/put options for different indian indexes/stocks?
If you are referring to historical Option Chain analysis (any date, any expiry, any contract), it is available on Trader's Cockpit however it is a paid feature.
Alternatively, you can check the NSE website. You can see the historical price of any given option at the following URL:
http://www.nseindia.com/products/content/derivatives/equities/historical_fo.htm
Hope this helps :)
True, NSE website has data abt everything.
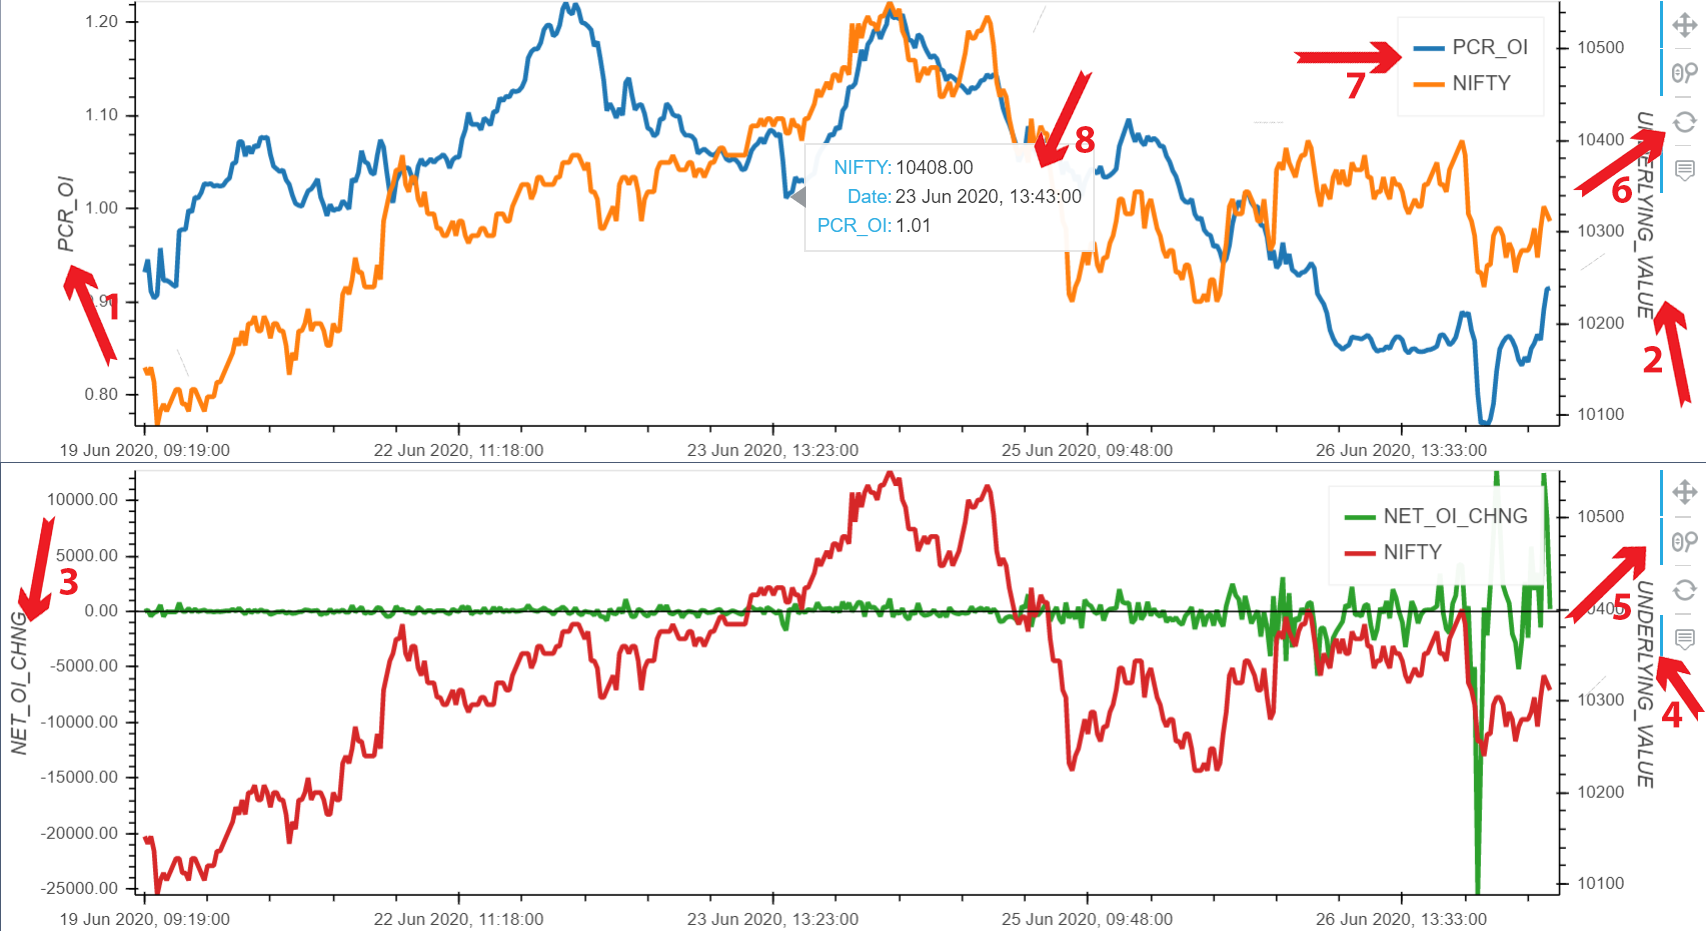
I have developed this website to monitor/ analyze option chain for Stocks and Index(NIFTY and BANKNIFTY). this is a free website, no ads till now. You can use this website to see intraday graphs and data even for contracts that have been expired. You can create custom graphs and see data on tables and even download intraday option chain csv files. Looking forward for your suggestions https://hioptionchain.herokuapp.com
Some Keys feature:
- NIIFTY and BANKNIFTY - 5 minute timeframe 2 weeks of data
- Stocks - 2 months data for an expiry - 1 hour time frame.
1 Like
bro you have done an excellent work, plz put some ads in it, market this website in traders, they will love it.
1 Like
Thanks for providing your valued feedback, it means a lot. The plan is to be keep ads to minimum and maximize the customer base, tried to promote it but could not reach to many as I am not a trader myself, If you like it please spread the word.
i tried to use it but the chart is not accurate, as the high lows are different on nse site.
There will be some difference in the highs/lows because I capture the data at a fixed point, say 9:15, 9:20,9:25 etc. and maybe there was a low/high occurred at 9:18 or 9:22 etc. so I cannot capture it. So the chart can plot only the points I have recorded.