Hi everyone,
Whenever I sit down to plan financial goals, compare index funds, or evaluate yield instruments, I often find myself juggling multiple spreadsheets or factsheets from various AMC’s and outdated calculators that miss real-world Indian market nuances—like tracking error drag, realistic debt yields, or clear dividend breakdowns for REITs and InvITs.
And, with passive funds gaining popularity among investors, I’ve spent the last few months building profinplanner.com to solve this. It’s a focused suite of financial planning, passive fund analytics, and basic facts about investment trusts designed ground-up for Indian retail investors.
Highlights of what’s live:
• Passive Fund & ETF Analytics: Historical tracking error, direct expense ratio (TER), and AUM trends across Indian index funds and ETFs to help spot replication drag before investing.
• REIT & InvIT Facts Hub: A dedicated, clutter-free research page covering Indian REITs and InvITs—tracking yields, distribution history, and key financial metrics so income investors don’t have to dig through complex quarterly PDFs.
• Privacy-First: No mandatory signups, no phone numbers collected, no spam—your financial scenarios stay strictly in your browser.
The platform is free to use, and I’m actively iterating based on feedback from actual DIY investors.
If you have 5 minutes, please share your feedback for https://profinplanner.com
Thanks a lot for helping a fellow DIY investor refine this!
3 Likes
@passive_investor first of all great work. I really liked what I am seeing 
Going to use this on regular basis. So far went through Nifty 50 funds, and got following feedback for improvement (this is not complaints so don’t get disheartened please)
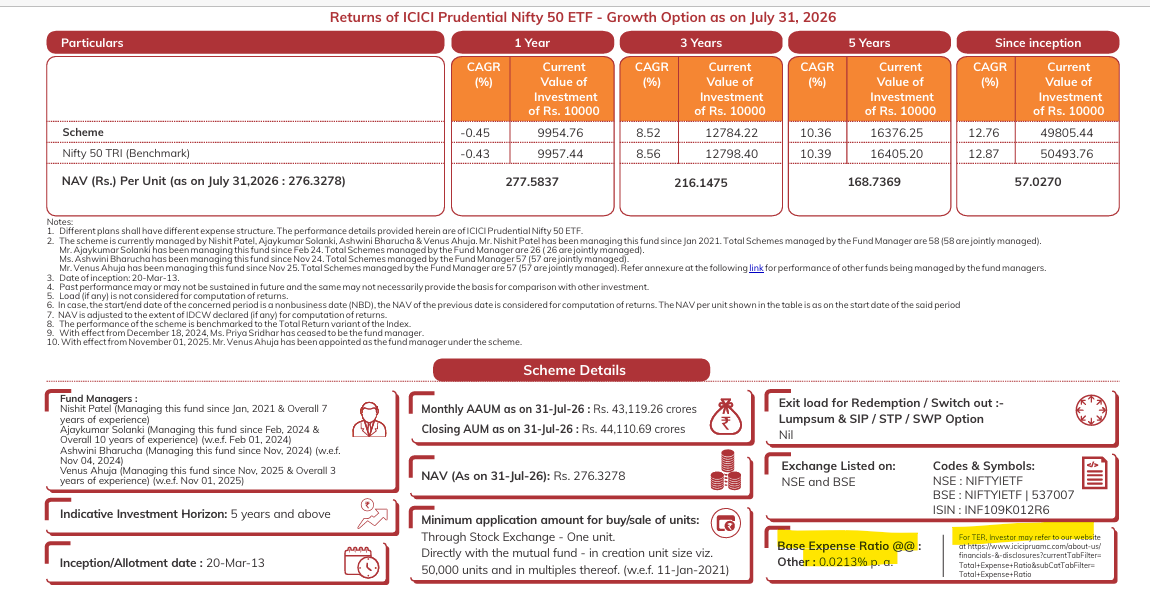
- Many funds are missing expense ratios which is surprising because every fact sheet should have it. Did a sample check for
And fact sheet does have it but they have BER and shifted all TER to Annexure 1
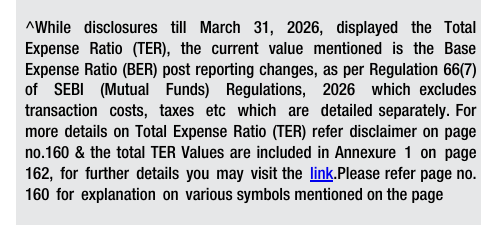
This complicates your work, but if major funds have TER missing, point of comparison is lost.
Also, expense ratios are not picked up uniformly.
For example it is showing that this fund has lowest TER
But fund’s factsheet shows that number is BER (and not TER)
So seems like BER and TER are mixed up and comparison might not be apple to apple
- Looks like for some funds data is very old
There would be reason for this, but again this skews comparison. Maybe put up some filter to discard funds from list if they do not have current data or way outdated data.
Again really impressed with work. Will be using it more
2 Likes
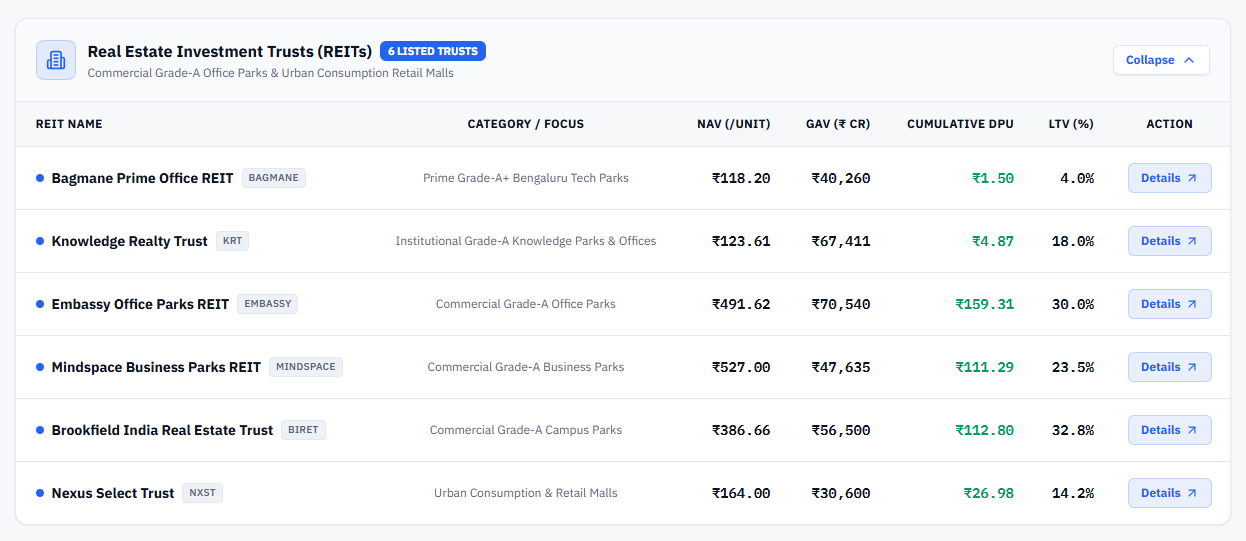
For REIT (and INVIT too) cumulative DPU is good to have but does not add any value in comparison because each REIT has different listing history.
So I am not sure how I can use it to compare funds
Better metric to put up would be Average distribution yield (distribution in last 12 months / price) or something similar.
Also, it would be really great if you can add field for Taxable component for distribution. That is a useful number to know before investing.
1 Like
Thanks for the suggestions @Akash_Shah!
It will be definitely useful to have the dividend yield instead of cumulative DPU. So, I have added Dividend Yield to the listed investment trusts instead of cumulative DPU.
Regarding taxable component in dividend, I will review this in the coming weeks on how distribution is impacted because of https://www.financialexpress.com/money/big-tax-change-for-reit-invit-investors-what-the-2026-taxation-bill-means-for-investors-4313093/ and then make changes as required.
Regarding Passive Fund Analysis for DIY Investors - #2 by Akash_Shah, I have added TER for all funds.
1 Like