Friends why traders are failing , in one clear point is, they don’t know the chart reading.
Markets runs with the help of candles which makes demand zone and supply zone but without knowing any knowledge of zone people start to trade.
To be a trader you need to give time to chart reading.
What you should read on chart:-
On any chart DZ (Demand Zone and Supply Zone (SZ ) is formed with the help of candle wicks, you should focus on candle wicks, unless you understand the candle wicks you can not be a trader. It is a slow process but the real path of success.
Traders don’t know the path to succeed. they work hard but in wrong direction.
Work on this direction and you will find all answers of your queries.
Chart reading starts with a Question ’ WHY’
You should focus and think why price is droping from a certain level to a certain price and
why price is going up from a certain point to a certain point.
I think you need to get experience in trading by using by your own money , at -least use google to post about chart reading if you are so interested to post in Trading Q&A or get ready to be trolled
Chart reading is important, but demand and supply zones alone don’t guarantee success. Wicks can show price rejection, but they don’t always tell us why the price moved. Risk management, discipline, and proper backtesting matter just as much. The real skill is learning which setups actually work over time, not just finding zones on a chart.

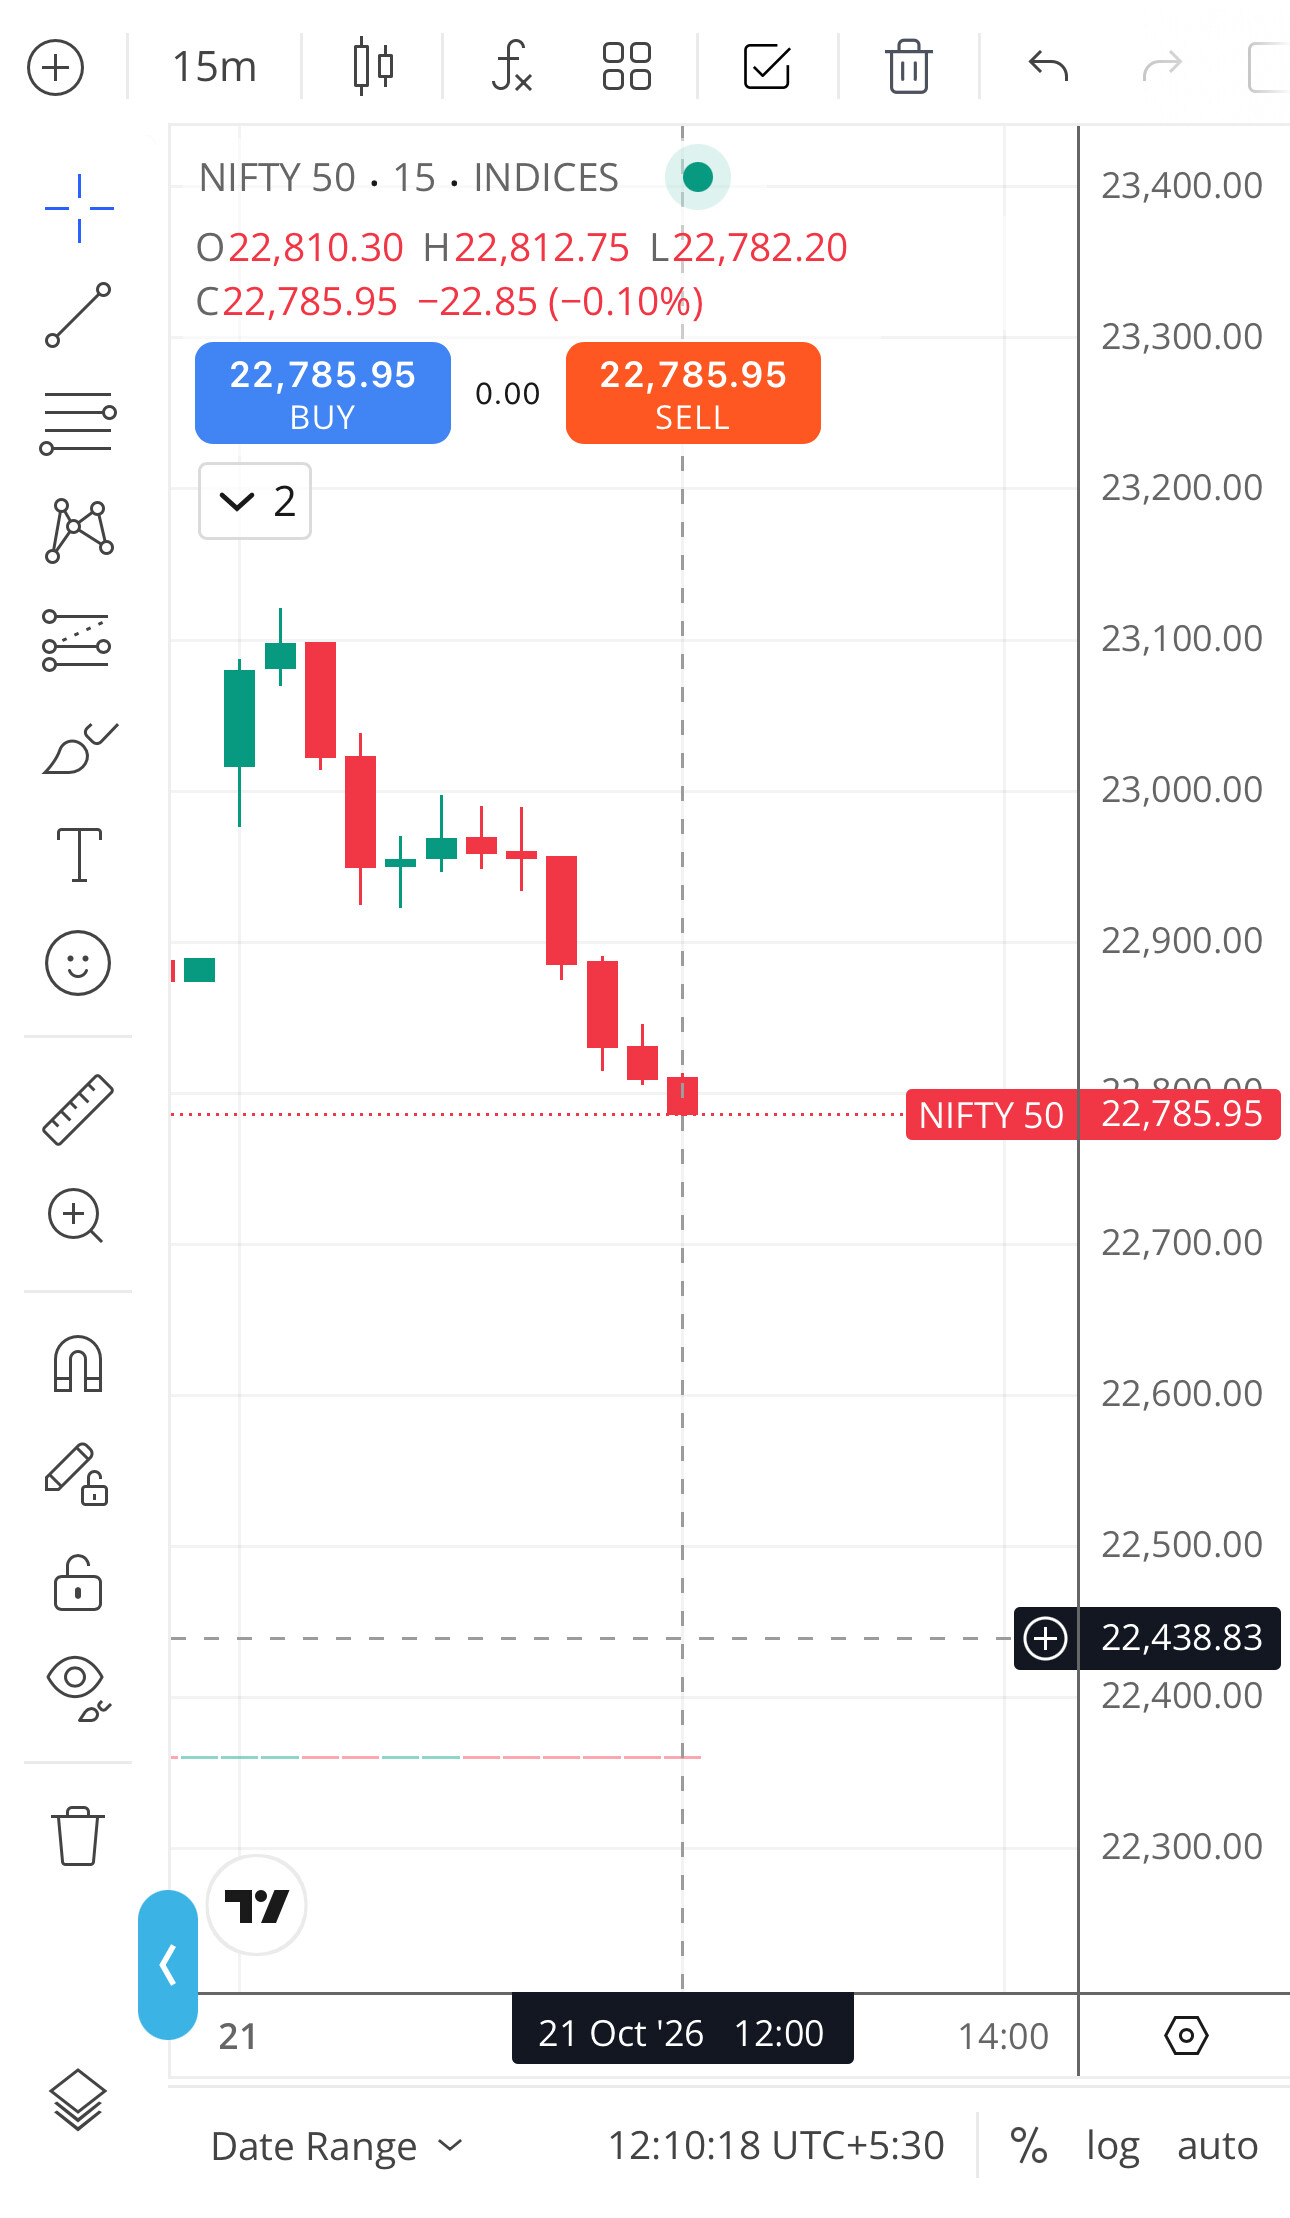


 only for Birdseye view


