So a few questions for those who trade classic chart patterns.
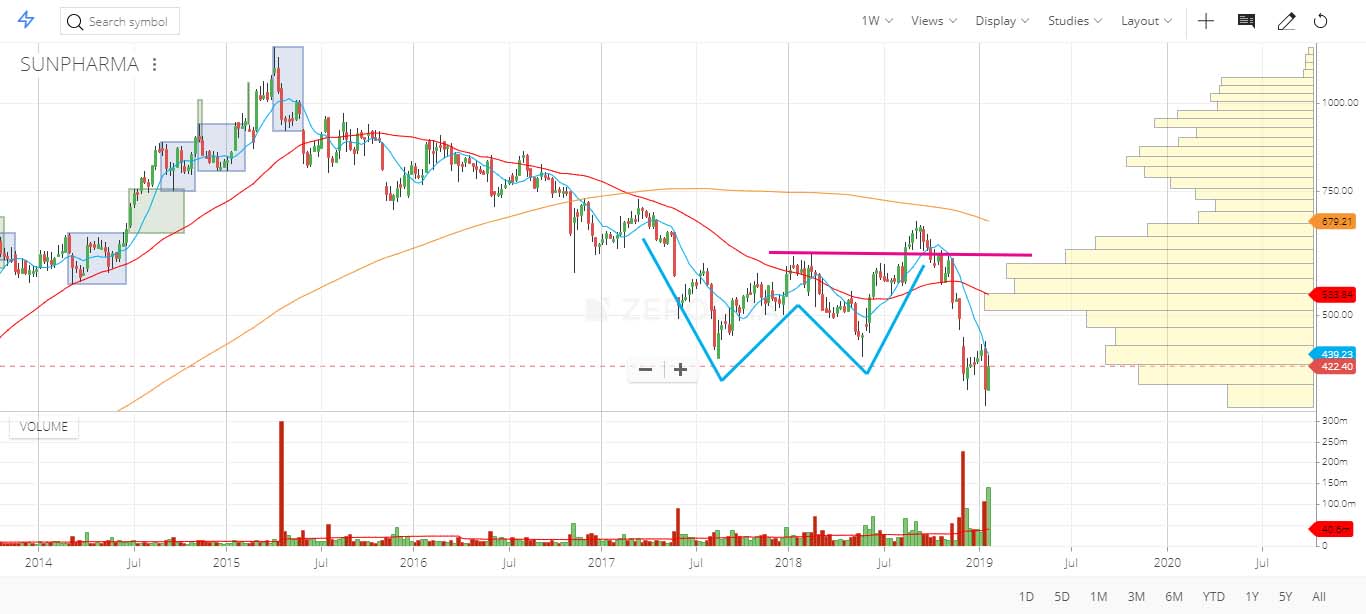
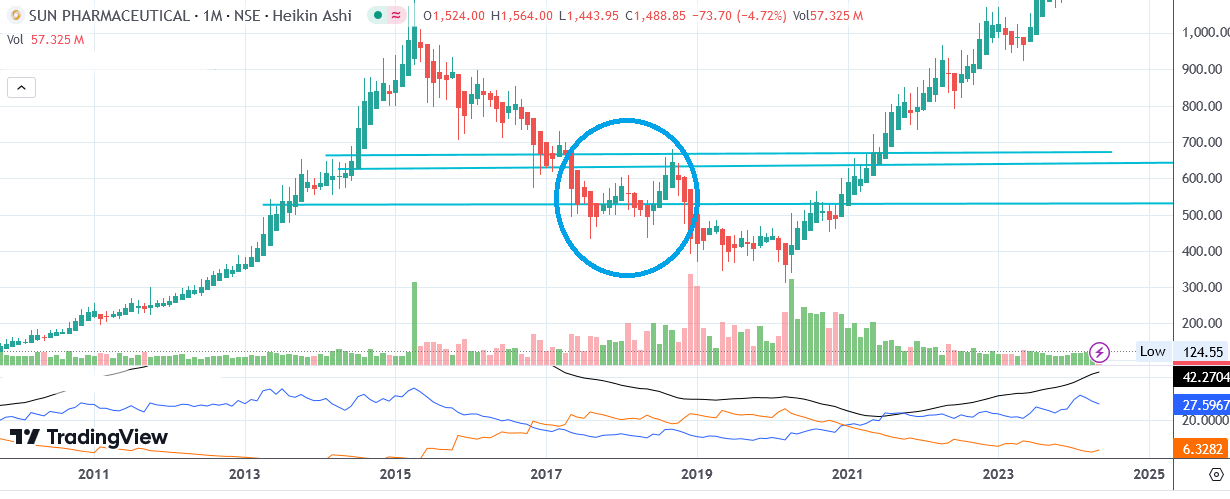
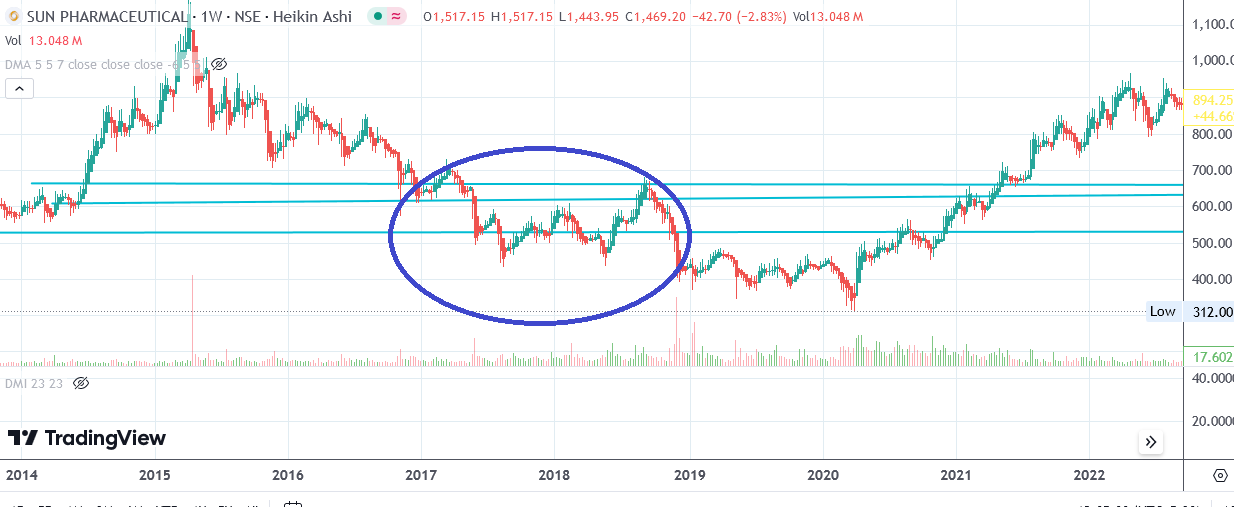
When do you consider a pattern to have failed? For instance, on the Sun Pharma Weekly Chart, a Double Bottom breakout occurred around 610. So when the stock fell back down again, is the movement below the Double Bottom Peak at 610 the failure? Or is it the move below the Twin Double Bottom Valleys at around 436, that should be considered the actual failure?
If a breakout/breakdown on a chart is caused by news, is it considered a valid breakout/breakdown? Often, news based trading activity makes for a very strong bar. So if such a bar is the one that completes a pattern, is it considered a valid completion? In other words, should you at all bother about what has caused the breakout, & simply take the chart at face value?
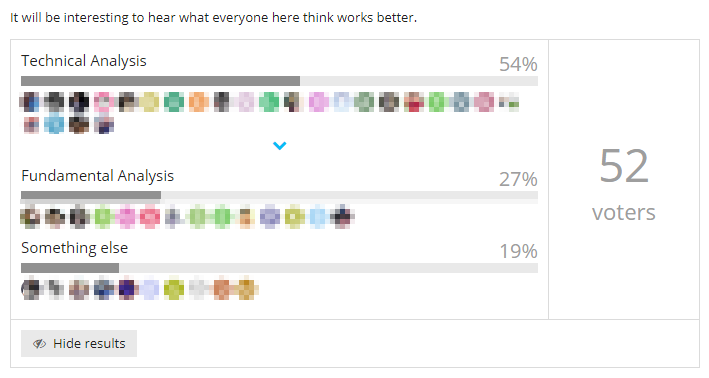
Chart patterns in 2019 ? Sounds strange, when large majority of the trading volume is done by algorithms.
Majority of market participants still follow either fundamental or technical analysis for their trading decisions. Heard the saying, majority is always wrong ?
Following and doing it correctly are two different things right? I personally think trading is all about risk management, but you still need to have some strategy to trigger a buy/sell - fundamental, technical, gut, quant, or whatever.
I kind of agree with Jack, the good thing with technicals is that if you are doing it right, it means you are disciplined, and technicals never let you go against the trend. The biggest reason for people to lose money in the market is because people inherently like to go against the trend, buy stocks which are falling and sell those which are going up. So the odds of staying profitable is a lot more. But can these strategies make a lot of money, hmm, that I am not sure of.
When i searched for " Double Bottom " on weekly chart of Sun Pharma at 610 level was not visible , its visible only on Monthly chart at about 490-500 level , can you post a double bottom chart on Weekly chart of Sun Pharma ?
When the break out candle is fully retraced, the breakout is in doubt and pattern is likely to evolve into some other pattern. In this case the long green candle piercing thro 610 levels was retraced by equally long red candle.
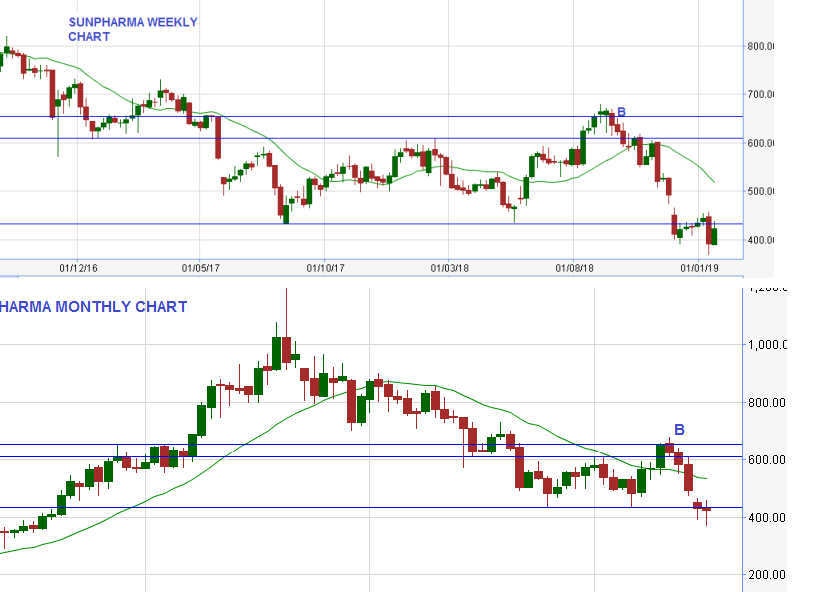
Well, you are right, Double bottom at 434 level and its breakout at 610 level( break out confirmation at point B )) was not sustained on weekly chart but on monthly chart ( point B break out confirmation ) clearly "not happened or Failed " and other chart indicators are also confirmed this,
I consider news based breakout as not valid one , Since i take the help of chart indicators , and trend-lines if breakout / break down happens because of news , i will take that as an opportunity to exit my holdings ,
Personally I feel this kind of analysis has lower probability of winning. Its better to see the markets like a quant does. Of course risk management is above all this.
Other than this , i don’t agree with your points , to trade or invest in stock market one needs to have a method, chart patterns are just one part or one of the method of of TA . and in case of Sun pharma chart pattern , i traded this pattern , entered Sun pharma at 570 and exited sunpharma at 604 , About the video , posted by you , i think the presenter is having some kind of bias against TA
Stock market is about probability. Even a monkey throwing darts will get some of the bets right. So many methods will succeed including chart patterns. But some have higher probability than others. When you dissect the data and look under the hood, you will increase this probability several fold. In patterns you are studying only one parameter. That is the shape of prices. So probability is not bumped up much.
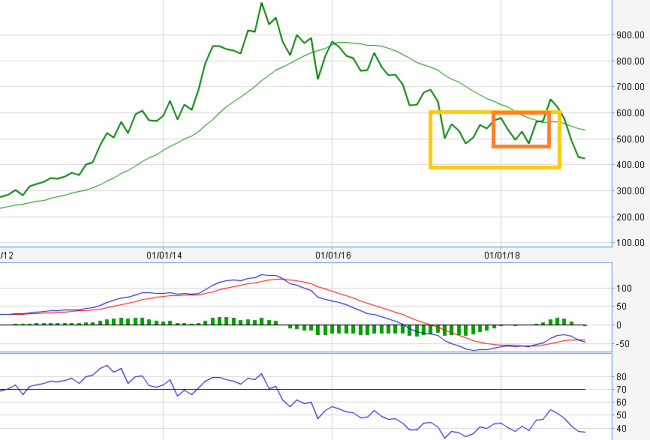
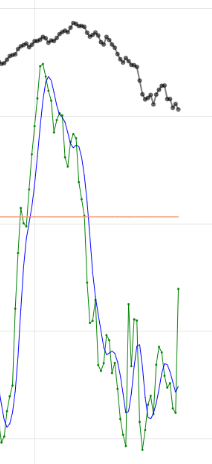
Example : Suppose you are Nifty 50 trader. You apply your pattern logic and come to a decision. But you also so see what the FIIs are doing because they have a significant influence on Nifty. So you study their data…and come up with this FII chart shown below…This is OCT 26 2018(last point) and you can see they are going long already(green line), after which Nifty shot up. Also see how they started shorting early at the top.
So what I want to say is … study of FII data and a confirmation from it will give you much higher confidence than just patterns alone. In other words the more confirmations you get from multiple sources that much safer you are or the probability of winning goes higher. Of course, you can also study FUT and OPT data and increase probability even higher. This does not mean that if you next study astrology the probability of winning will increase even more. Because this astro parameter is mostly of lower quality. It doesnt add much.
And the video quotes evidences. So I think it is believable. Yes EVIDENCE is the key word in all of this !
Interesting that you consider a valid confirmation to be a close not just above 610 but a much higher level at B. Is it because you follow monthly charts? My understanding is that the breakout was confirmed, at least as far as weekly charts go.
Well, there are 2 things in analyzing or consideration on “double bottom chart pattern” Double bottom pattern is comparable to the letter “W” if break out happens , i consider left & right tip of the pattern as a valid one if stock price closes above that. ( at point B) , your point is also correct if you are considering middle point ( point A) of the chart pattern, Many times middle point break out fails , its my experience too! but is useful for short term trading. I do consider not only chart pattern but also other indicators( MACD, RSI) and trendlines, if you look at weekly chart RSI was in overbought level, where as on monthly chart MACD line didn’t crossed above “0” line. ( I do consider monthly chart , if , something is not clear on weekly chart.
I’m a fairly new gambler. Just been about a year and a half or so in the stock markets.
I’ve started off with a William O’Neil/Mark Minervini-ish kind of strategy. I say ‘kind of’ because I don’t strictly adhere to it. Not yet anyway.
But because of that I’ve not really looked at indicators & such. Will do so eventually. But it’s always interesting to see others’ take on trading the financial markets.
I have gone through some of William O’Neil articles but i feel he is not either Technical analyst or Fundamental guy. i feel its better to consider other chart indicators while analyzing different chart parameters to avoid whipsaws.