Please do a Technical and Fundamental analysis on Samvardhana Motherosn Sumi International
why not learn technical and fundamental analysis and try it yourself?
3 Likes
Varsity if you want to learn:
Chart and google finance if you want something fast. ![]()
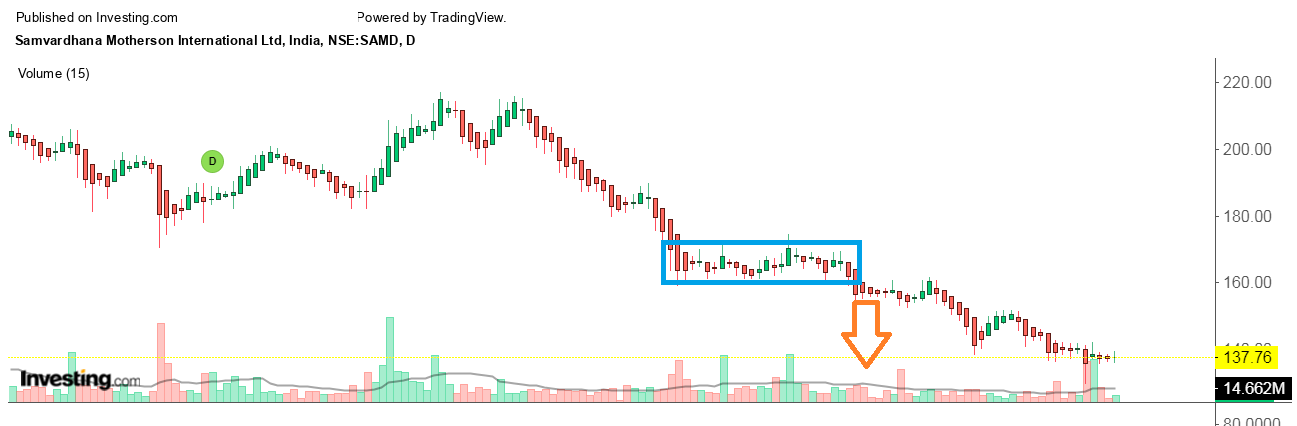
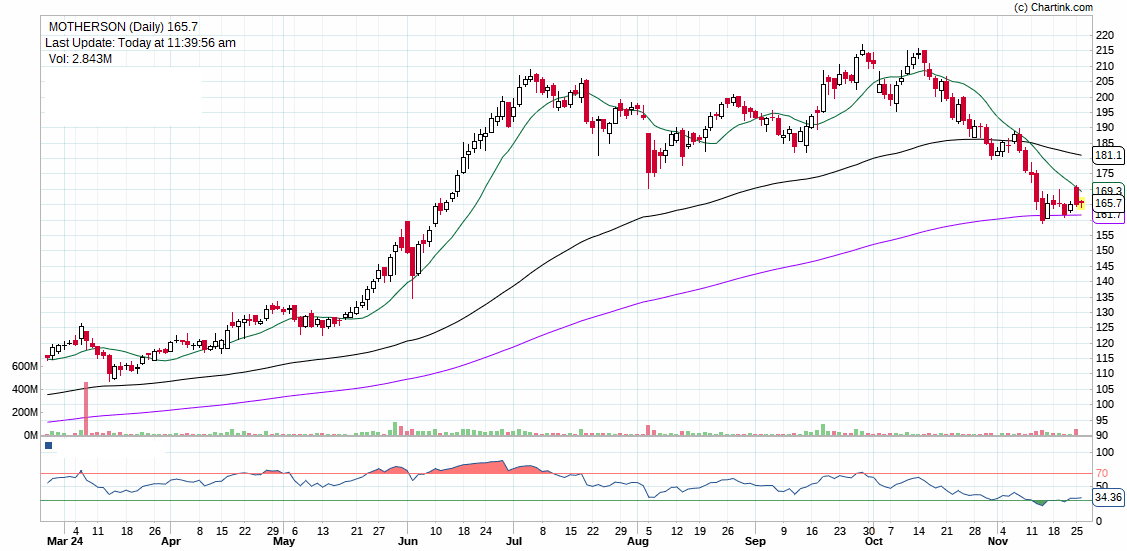
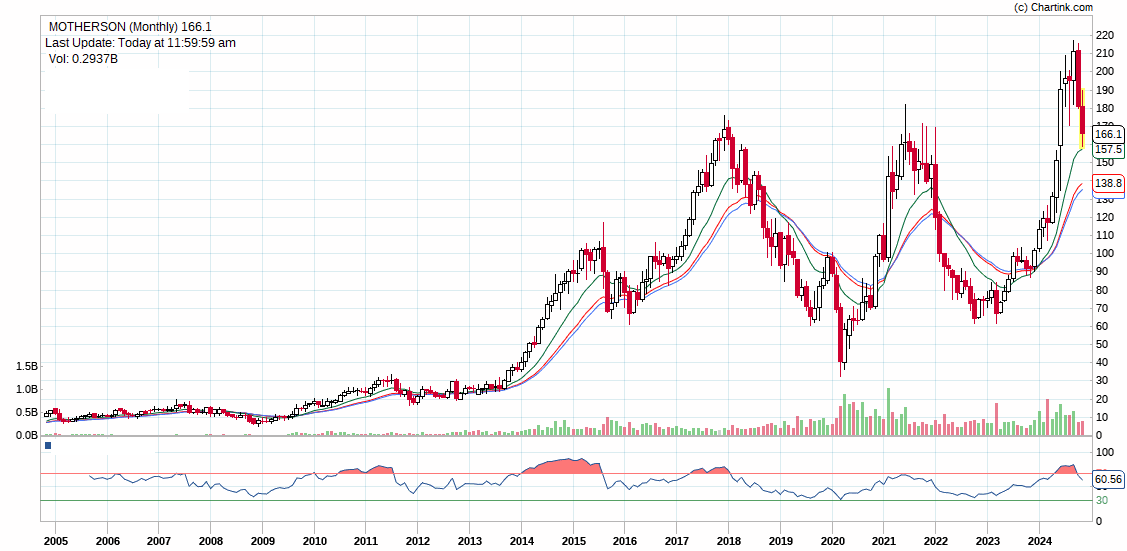
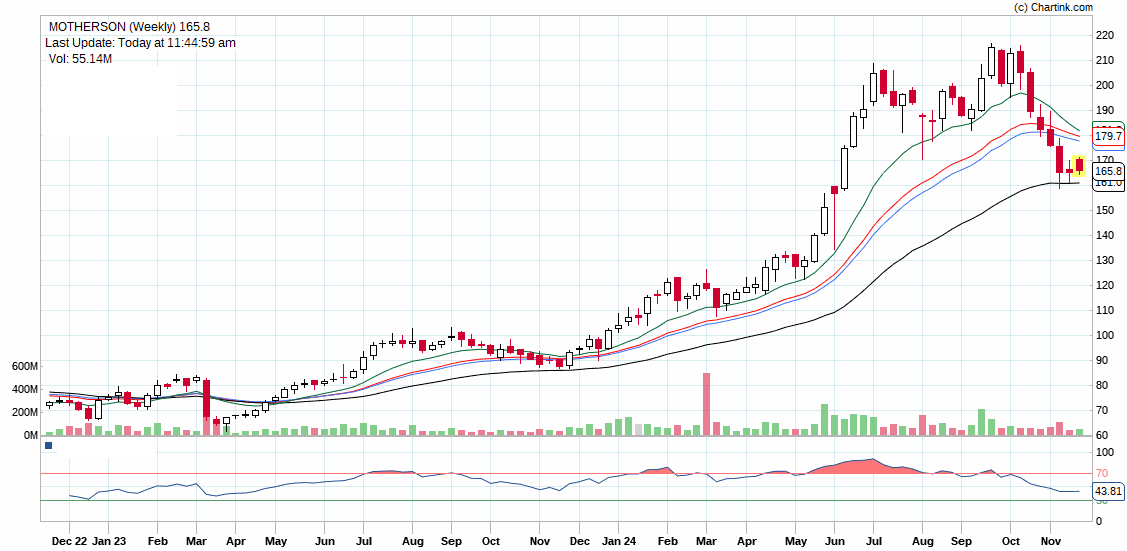
Let me do it for you , but not a recommendation , Mainly i do follow TA , but still i will share my fundamental analysis also ![]() , present per share value is Rs.165 Book Value is Rs.37.2 having face value Rs.1 , its EPs DPs are increasing and also its Net income , Revue and Market sharers are increasing . Dividend Yield is 0.48% , Promoter holding is around 58% Mutual funds holding a5% FIIs holding 13% DIIs 4% good thing is that Retail&others having 8% So fundamentally its Ok but Technically it was overbought on Monthly chart , but recent corrections made it to the zone of oversold position and Motherson has taken a good support on a major trend line It made “W” format on long term chart but correcting back to its Neck line level of Rs.120/- It seems to be Motherson is in a Range , For me its direction is not clear .
, present per share value is Rs.165 Book Value is Rs.37.2 having face value Rs.1 , its EPs DPs are increasing and also its Net income , Revue and Market sharers are increasing . Dividend Yield is 0.48% , Promoter holding is around 58% Mutual funds holding a5% FIIs holding 13% DIIs 4% good thing is that Retail&others having 8% So fundamentally its Ok but Technically it was overbought on Monthly chart , but recent corrections made it to the zone of oversold position and Motherson has taken a good support on a major trend line It made “W” format on long term chart but correcting back to its Neck line level of Rs.120/- It seems to be Motherson is in a Range , For me its direction is not clear .
Please note that the above analysis is just for Knowledge sharing not any recommendation ![]()
1 Like