Hi,
I want to plot day10 EMA value on Kite intraday chart. EOD 10 EMA value should reflect on any TF (5 mins to 1 hr.
Kindly let me know how do I plot it.
Thanks,
TT
Hi,
I want to plot day10 EMA value on Kite intraday chart. EOD 10 EMA value should reflect on any TF (5 mins to 1 hr.
Kindly let me know how do I plot it.
Thanks,
TT
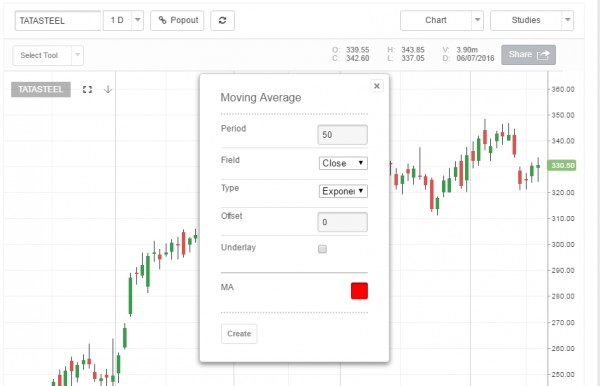
open chart on kite and go to studies and search for moving average and enter the parameters and select type exponential and plot the EMA. you can change the time frame of the same chart with EMA indicator
I am aware of above plotting. However looking out for EOD 10 EMA value on Intraday chart. I am having an AFL, looking out for same types in Kite
Plz find below AFL.
_SECTION_BEGIN(“Price”);
SetChartOptions(0,chartShowArrows|chartShowDates);
_N(Title = StrFormat("{{NAME}} - {{INTERVAL}} {{DATE}} Open %g, Hi %g, Lo %g, Close %g (%.1f%%) Vol " +WriteVal( V, 1.0 ) +" {{VALUES}}", O, H, L, C, SelectedValue( ROC( C, 1 )) ));
Plot( C, “Close”, ParamColor(“Color”, colorDefault ), styleNoTitle | ParamStyle(“Style”) | GetPriceStyle() );
_SECTION_END();
////////////////////
Plot(EMA(C,10),“EMA 10”,colorTan,styleLine);
_SECTION_BEGIN(“Daily EMA”);
TimeFrameSet(inDaily);
daema=EMA(C,10);
ddaema=TimeFrameExpand(daema,inDaily,expandFirst);
TimeFrameRestore();
Plot(ddaema,“10 DEMA”,colorBlue,styleStaircase|styleDots);
_SECTION_END();
In Kite uses the standard indicators with styles , it can be customized as in amibroker