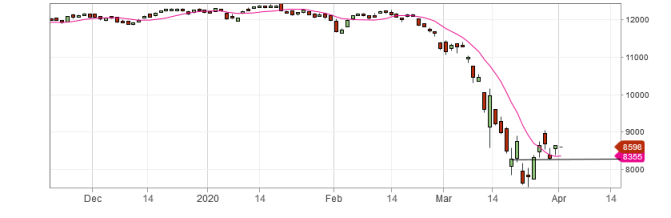
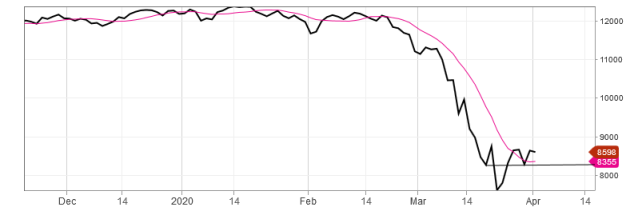
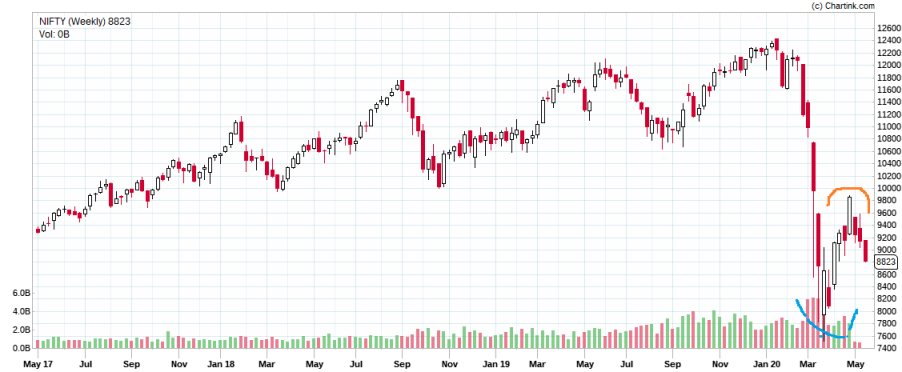
Today Nifty has completed "Inverse H& S formation on daily chart, a sign of Nifty up-move and recovery
Bhav bhagavan che !

Check out long wick bullish candle on 6th Feb 2018, took nice support there.
You mean at the lower end of that candle?
Yup…
Bro, in 27th minute trade why didnt you put buy order at Gap up as well? You missed one earlier during first trade as well.
Nifty has completed both "Inverse H&S " , normal "H&s " formation on both Daily & weekly chart , and so in the process of " double bottom formation " on monthly chart . Going by the present time ( 18-5-2020-/ 10PM , a huge rally on World indices ) Probability of Double bottom on Monthly chart of Nifty is high , "Finger crossed till next closing Trading day for the confirmation " Probability of reversals on Indices on 19-5-2020 !!! ??

Yes, dow jones is 3.5% up…
There is this video by E learn Markets about a guy who catches falling knife. I mailed him and he said that price drives the volume. He also has an interview with money control. His name is Naresh Nambisan.
Alternatively, if you are looking at strategies, Donchian Channel Breakout system.
Is it possible to set up algo trading on Support & Resistance? For example: at the support level Long & exit at Resistance level? How the algo can understand my Support level & Resistance Level?
@leodecaps @maddy_Des @Gurly7 @rahulkhanna @trader_dude @saurav106 @ShubhS9 @leodecaps @vikram_rao @vishnux
- Support & Resistance are zones and not lines.
- people use various logic to identify levels or zones.
- Few examples are William’s Fractals, Volume Profile, Market Profile etc.
- But as trading SRs is part of Price Action just like trend lines are, it is mostly discretionary trading method. Very few traders include mechanical Rules to it.
- There are few prop softwares out there which can draw TLs automatically
- Google “Auto Trendline”, “Auto Support-Resistance”. you will get many indicators.
Yes
All logic u follow while deciding ur support and resistance level can be beautifully programmed (many already simply exist ![]() ) and according to an old saying, whatever u want is available in market! But again limitation of this strategy is, market doesn’t respect lines on charts that well. Yes Ofcourse you get more time to invest when your trades are automated.
) and according to an old saying, whatever u want is available in market! But again limitation of this strategy is, market doesn’t respect lines on charts that well. Yes Ofcourse you get more time to invest when your trades are automated.
How to add a Moving Average based on Rsi indicator in Kite Web Zerodha Tradingview chart?
@leodecaps @maddy_Des @Gurly7 @rahulkhanna @trader_dude @sekhar916 @Newbie420 @abhi9392 @ShubhS9 @vishnux
Not possible on TV. Possible on ChIQ