Coal India on 1H timeframe, is it right… https://www.tradingview.com/x/OeWMWZgH
1 Like
Which is the first candle you are referring to? I am not able to figure that out. If you can mark on the chart then I can comment quickly.
Yes it’s fine.
Any other area where I should’ve drawn levels?
In that time frame, in that snapshot, nothing else.
What is ideal timeframe to draw levels for Intraday, I use 15m chart. Will these levels vary based on timeframe? Also how much previous prices should we take in consideration?
Yes levels will vary depending on time frame. There is no ideal time frame as such. Market is fractal in nature. 15 min for intraday is a good time frame.
Previous PA is the overall guideline, but since we are dealing with institutional pending orders which we can never be certain about, so newly formed PA is always a better gauge for taking action. That’s my personal take, if you follow Red’s style, he often did take previous PA based zone directly. Initially during my learning journey I had lost lot of money due to this, so I switched to a more conservative style of confirmation PA, which also leads to many missed opportunities. That’s fine with me, better safe than sorry. You can develop your own style once you move onward in your own journey.
1 Like
1 Like
Look at CholaFin 15m chart, I’ve marked Demand Zone, where do I mark Supply Zone? There’s very big price rejection at top… or do I use HTF to mark Supply Zone… https://www.tradingview.com/x/o10YWQ6z
The nearest SZ on this chart would be the RBD around 296. Not commenting on the importance or utility of this SZ.
One thing I’ve learnt from this method is, there’s no need to draw plenty of trendlines which I used to earlier. It’s all about structure where market has made change after forming also it’s more about recently formed market structure rather than past structures.
3 Likes
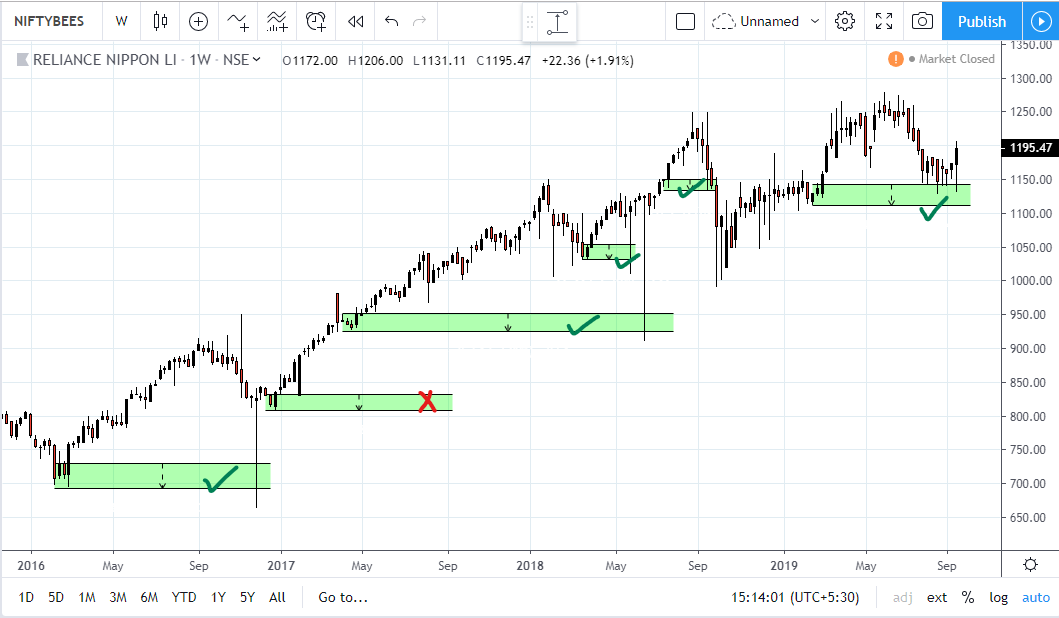
I received a question whether this style of PA reading can be used for investing? The answer is yes, Once we do a bit of fundamental analysis and come up with good stocks for investment, we can use our style of PA for timing the entry. HTF(Monthly,weekly) PA as guideline and Daily or LTF (4Hr,2Hr,hourly) PA for confirmation entry yields superior results. I personally do it on NiftyBess for long term investment, I buy only with HTF PA.
These are some levels on the Weekly chart of Niftybees where I added for long time holding.
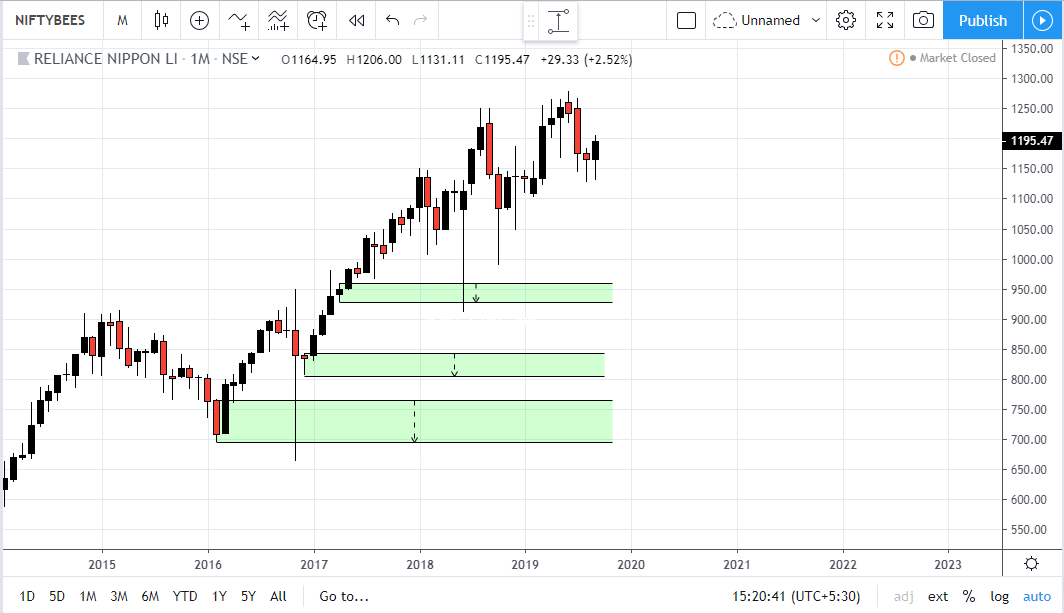
This is where on the Monthly, I would like to add more if it arrives:
1 Like
Shouldn’t you be doing research on Nifty to invest in Nifty Bees as Nifty acts as their underlying?
Yes correct, Niftybees is correlated with Nifty, but to keep my limit buy orders in the system I mark the Niftybees chart to get the buy price levels. If you observe the two charts carefully, you will see some difference in their individual PA due to Niftybees’s own order flow.