Hi,
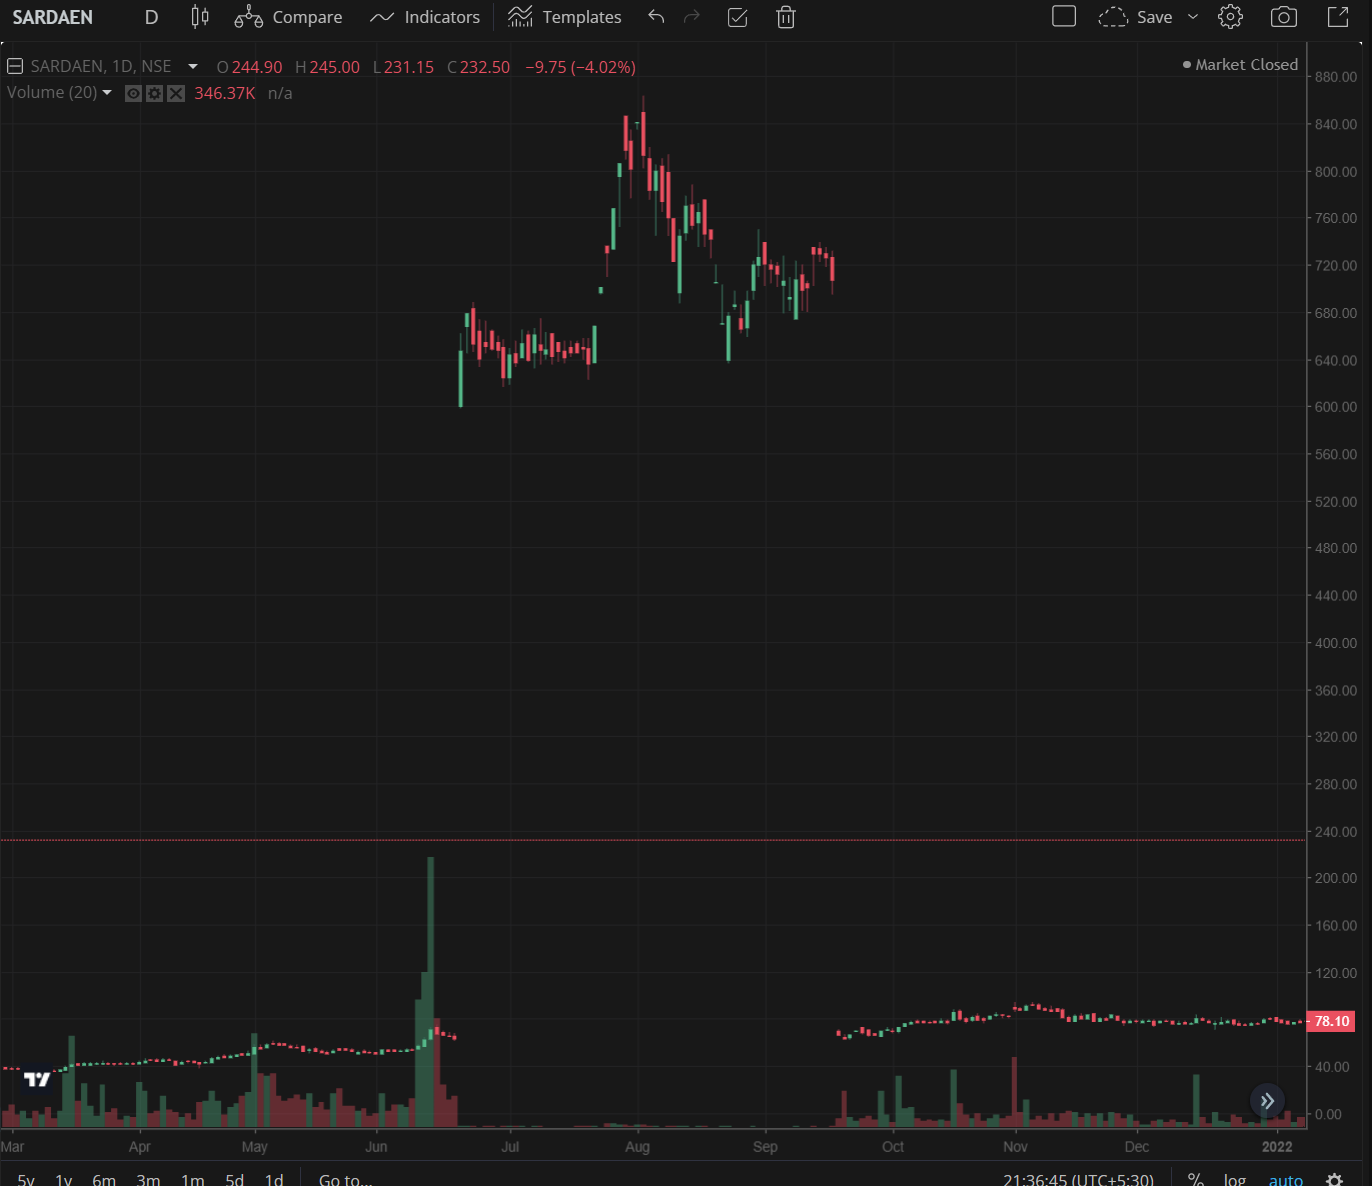
Can someone please help me with what has happened in the SARDAEN chart on Kite during mid-June to mid-Sep of 2021. It is showing a huge price jump and then reversed back to around the same price after that. Below is the chart from Kite.
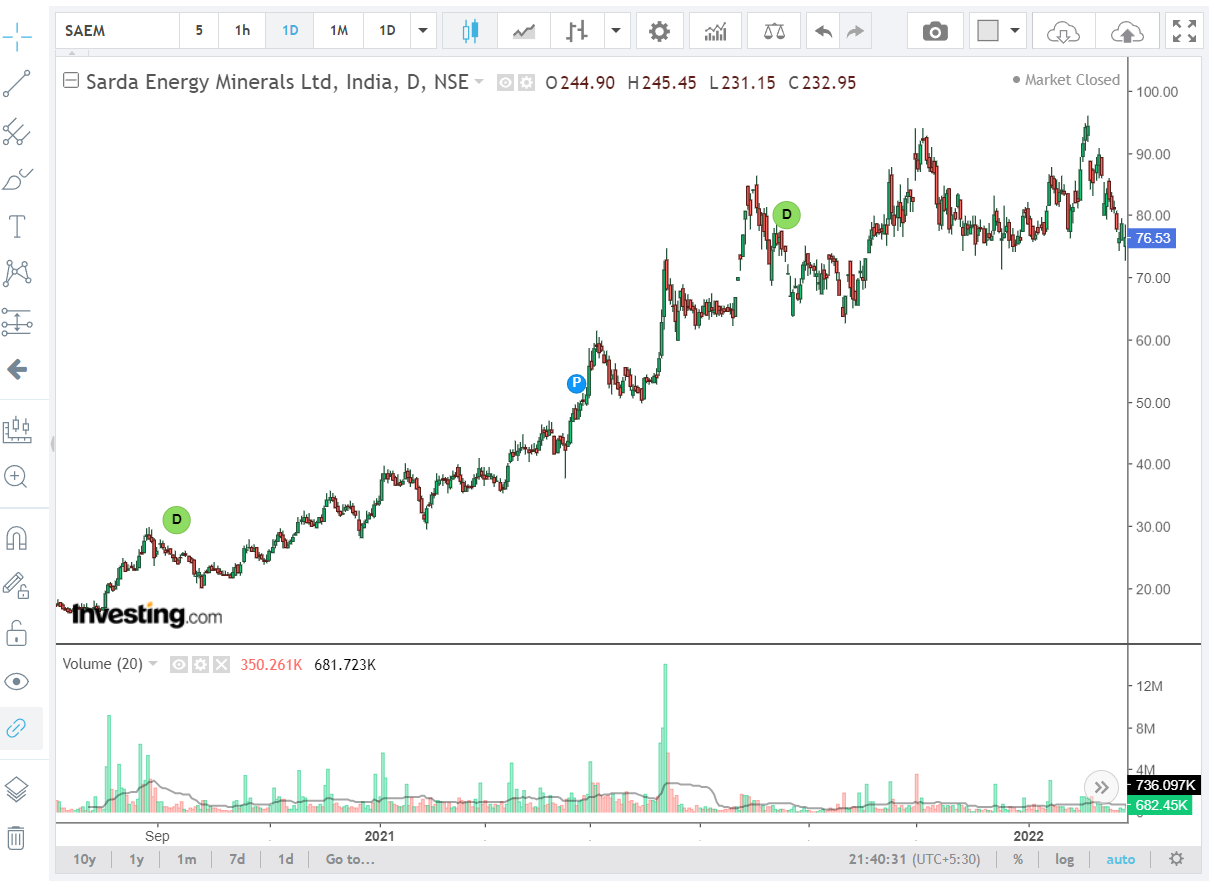
But, same is not seen on charts elsewhere. Below is the same chart from investing.com
Thanks.
Can anyone help with this please?
Have you seen anything similar in any other charts?
This happened due to series change and stock split during that period. We’ll adjust the charts. Thanks for reporting.
For now, you can use check charts on BSE.
Thank you for the update!