When I see PSAR in Zerodha, it comes as a line chart. But when I use third party tools outside Zerodha, I see Dots. Why this difference in Zerodha?
What do you mean by the above? Can you attach a screenshot
psar crossover is giving weird alerts in in pi. it is giving buy signals even when there is no cross over.The value in psar blue curve below is also different from that shown on the chart in orange.Someone else facing this problem?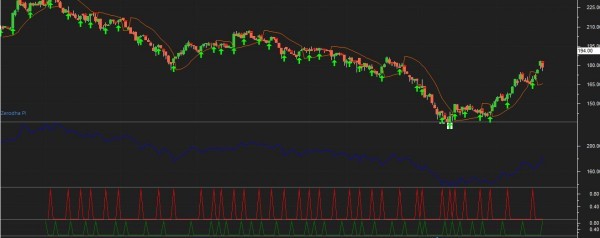
Well, I donot see any option to upload the image. Let me explain again. In PSAR we would generally get dots on uptrend and downtrend. But in Zerodha Charts PSAR shows line chart. Is this a BUG ?
not a bug. That is not line chart!. Just the representation of PSAR is different. Instead of dots. there are dotted lines
Somehow not comfortable with this special chart of Pi. The Dots which other tools offer are more informative than this.
Same problem with me too. Dont understand why they have changed the PSAR behavior itself. They need to show red and green dots when there is sell and buy signals. Instead they are showing dotted lines 
the red and green dots are not a problem as long as the ceil and bottom are correctly depicted for each candle.i have tried all the solutions on zerodha links for psar…none of it gives the correct signal.In one answer the solution was this:
close>PSAR (CLOSE, 0.02, 0.2) AND REF (CLOSE, 1) < REF (PSAR (CLOSE, 0.02, 0.2), 1)
But the value of REF (PSAR (CLOSE, 0.02, 0.2), 1) is not correct when the chart is displayed,hence the wrong solution.
YES I ALSO FACING THIS PROBLEM
ANY ONE KNOW PLEAR CORRECT
Buy script
CROSSOVER(CLOSE,PSAR(CLOSE,0.02, 0.2)) = TRUE
Sell script
CROSSOVER(PSAR(CLOSE,0.02, 0.2), CLOSE) = TRUE
BUY I CHECK MANUALY PSAR CHART AND SIGNAL NOT MATCH PROPERLY