RBI has released its annual report for the year 2021-22 which contains a comprehensive summary and review of the financial year that recently ended. Here are some of the interesting stats and charts from the report.
1. Investments by FPIs in equity market
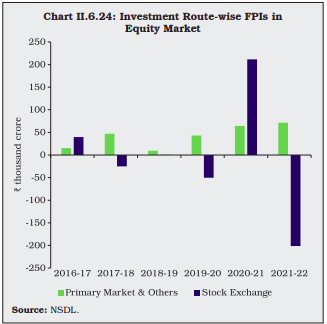
Source : Page 85
2. Inflation across Major Components

Source : Page 37
3. Domestic Oil Price Trends

Source : Page 43
4. 10-year G-sec Generic Yield

Source : Page 60
5. Investment in Equity
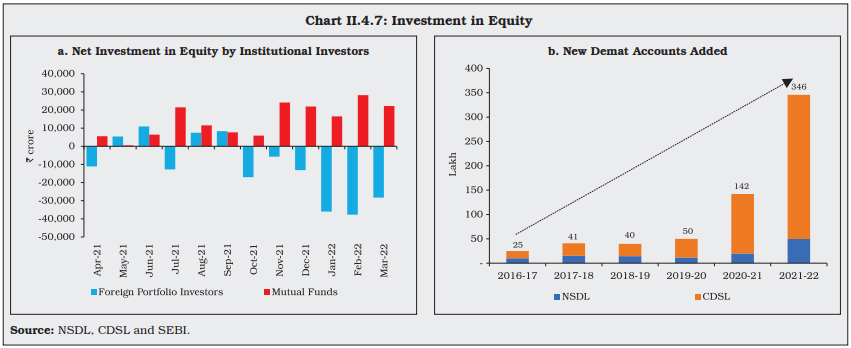
Source : Page 63
6. Resource Mobilisation

Source : Page 64
7. Ministry-wise Break up of Capital Expenditure 2022-23

Source : Page 68
8. The reserve bank’s account for 2021-2022
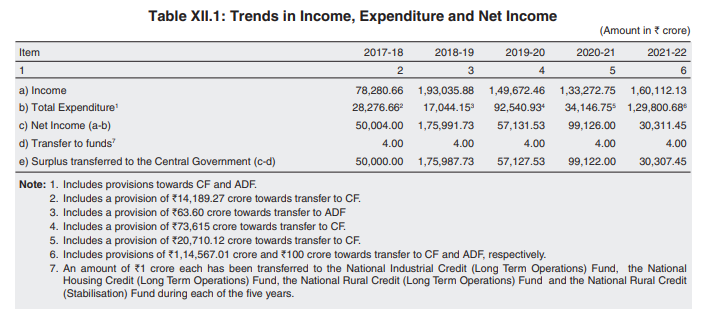
Source - Page 233
9. Currency in Circulation
The value and volume of banknotes in circulation increased by 9.9 % and 5.0 %, respectively, during 2021-22 as compared with 16.8 % and 7.2 %, respectively, during 2020-21
Source : Page 167
10. Payment Systems
The payment systems recorded growth of 63.6 % in terms of volume during 2021-22 on top of the expansion of 26.7 % in the previous year. In value terms, the growth was 23.1 % as against a decline of 13.4 % in the previous year, mainly due to robust growth observed in the large value payment system, viz., RTGS.
During 2021-22, payment transactions carried out through credit cards increased by 27.0 per cent and 54.3 per cent in terms of volume and value, respectively.
Transactions through debit cards decreased by 1.9 % in terms of volume, though in terms of value, it increased by 10.4 %
Page 175 & 176
11. SGB
The Reserve Bank, in consultation with the GoI, issued ten tranches of SGBs during 2021- 22 for an aggregate amount of 12,991 crore (27 tonnes). A total of 38,693 crore (90 tonnes) has been raised through the scheme since its inception in November 2015.
(1/3rd of all the SGBs issued from its inception were done in 2021-22)
Source : Page 163
12. Government Borrowing
The net short-term market borrowings of the government through T-Bills (91, 182 and 364 days) decreased to 66,248 crore during 2021- 22 from 2,32,540 crore in the previous year.
Commercial banks remained the largest holders of government securities (including T-Bills and SDLs) accounting for 37.4 % share as at end-March 2022, followed by insurance companies (25.6 %), the Reserve Bank (10.6 %) and provident funds (9.6 %).
Source : Page 162
13. RBI’s Balance Sheet
The size of the balance sheet increased by 4,82,633.14 crore, i.e., 8.46 % from 57,07,669.13 crore as on March 31, 2021 to 61,90,302.27 crore as on March 31, 2022.
Page 233
14. Corporate Debt Market
Primary corporate bond issuances decreased by 23.4 % to 6 lakh crore during 2021-22 as against 7.8 lakh crore during the previous year.
Source : Page 60
15. Equity Markets
The FPIs became net sellers for eight out of 12 months in 2021-22 with a net outflow of 1.3 lakh crore as against a net inflow of 2.8 lakh crore in the previous year. Mutual funds, on the other hand, made heavy investments worth 1.7 lakh crore in the Indian equity market in 2021-22
The direct participation of retail investors in equities continued to increase, with the opening of 3.46 crore demat accounts during 2021-22, as against 1.42 crore demat accounts opened during previous year. During 2021-22, on an average, 28.8 lakh demat accounts were opened every month, which is higher than 11.8 lakh per month in the previous year and 4.2 lakh demat accounts per month in 2019-20.
Resource mobilization through IPOs, FPOs and rights issues increased by 26.1 % to 1.39 lakh crore during 2021-22 as against 1.1 lakh crore during the previous year.
Pages 61 & 63
16. Credit to Agri Sector & MSMEs
The outstanding credit to MSMEs by SCBs increased by 13.4 % in March 2022 (10.6% a year ago)
The GoI sets the agricultural credit target every year for SCBs, regional rural banks (RRBs) and rural co-operative banks. During 2021-22, against the target of 16.5 lakh crore, banks achieved 104 per cent of the target (`17.09 lakh crore)
Pages 106 & 107
17. Investments and Savings
-
The financial saving of the household sector – the most important source of funds – surged by 3.6 percentage points to 11.5 % of GNDI in 2020-21, the highest in over two decades
-
The financial saving of the household sector in shares and debentures rose from 0.4% of GNDI in 2019-20 to 0.5% of GNDI in 2020-21
-
In 2020-21, savings exceeded investment for the first time since 2004-05. The surplus from the household sector amounted to 11.8 % of GDP in 2020-21.
Pages 18 & 19
18. Growth rates & Composition of real GDP
(At 2011-12 Prices) - Page 288

Which points have intrigued you the most from the RBI report? Do share with us on this thread.