Hey everyone! ![]() I’m considering keeping 50% of my margin open to seize opportunities on high VIX days when they occur. However, I’m a bit unsure if this strategy might hurt my overall performance
I’m considering keeping 50% of my margin open to seize opportunities on high VIX days when they occur. However, I’m a bit unsure if this strategy might hurt my overall performance ![]() .
.
Could anyone share how to analyze VIX patterns over the past 3 years? Specifically, I’m looking for tools or methods to track how often VIX shoots up or drops each month in the last 36 months ![]()
![]() .
.
Any insights or recommendations would be hugely appreciated! ![]()
![]()
1 Like
Not the answer you asked for but I tried “analyzing” vix and gave up. To me it is just another indicator which reflects the past/present but can’t predict the future.
I now use the ATM straddle price as an indicator of whether options are overvalued or undervalued. If the expiry is N days away, then today at 9:45AM, based on historical data, there is a certain value which is the par price for the ATM Straddle. If the current price is above or below par, then options are expensive / cheap and may be a good time to enter a sell / buy trade. This has worked well for me the past few months (the general election day being a huge exception).
2 Likes
The VIX behaviour has totally changed , so not sure studying past data would be very helpful . So in in early 2024 the pattern was massive spikes in VIX followed with instant meltdown . For the last few months VIX starts rising early in the morning , allmost doubles and stay there till 2pm with zig zag movement in the underlying . This Tuesday was a good example . I couldn’t find a good way to trade it yet , both buying and selling on these days end up being very risky.
2 Likes
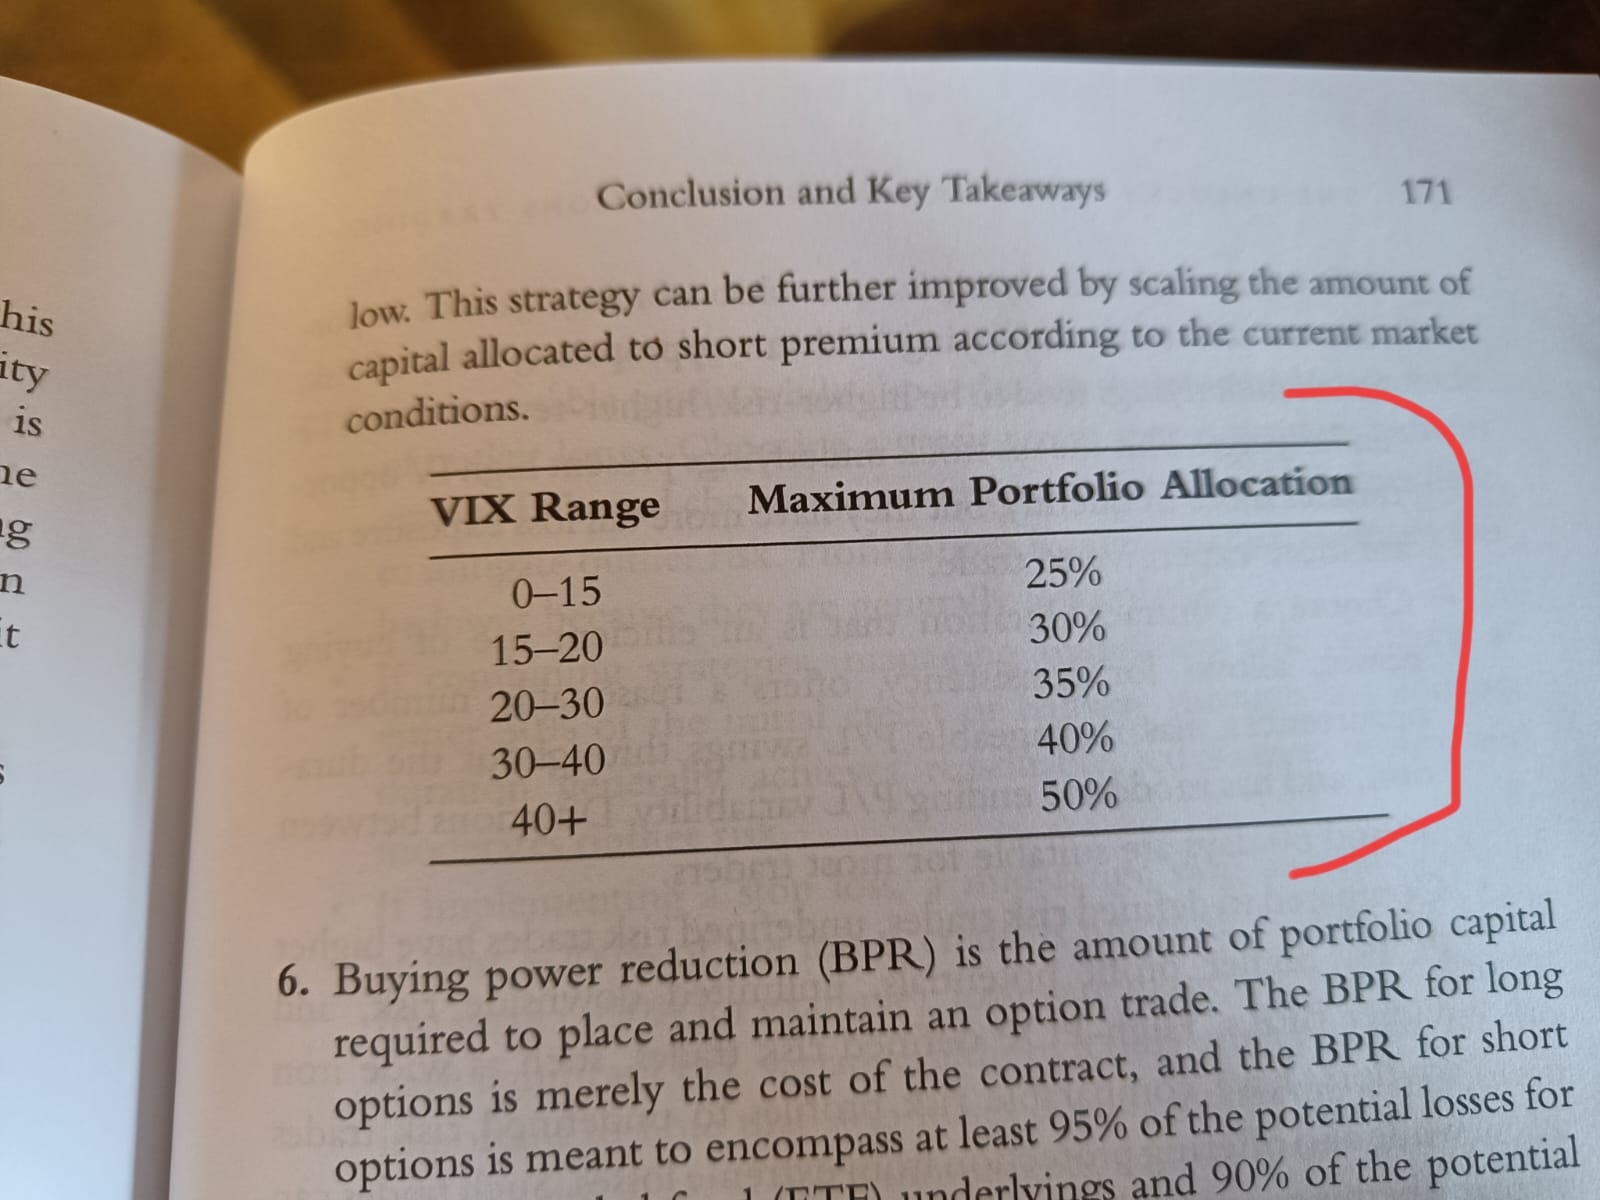
Tasty mechanics would have you utilize only 25-50% margin as per VIX. From The Unlucky Investor’s Guide to Options Trading ![]()
If you want to trade vol contraction, it’s a multi day process and should choose an expiry 45-60 days away. Depending on the vol, it may go against you before coming back down. ![]()
1 Like
Are you okay sharing the par price?
Would it make sense to enter into an expiry contract that is 45-60 days - on a high Vix date? Or shall any date will do?
Higher VIX = more capital allocation, better entries, less margin needed viz a viz low VIX conditions. ![]()
But don’t enter on a single day ![]() . Divide your maximum portfolio allocation into 8 tranches and enter every week (any day, doesn’t matter in the long run) for 8 weeks, at the end of the 8 weeks take one off and enter a new one. DTE must be at least 45-60 days away.
. Divide your maximum portfolio allocation into 8 tranches and enter every week (any day, doesn’t matter in the long run) for 8 weeks, at the end of the 8 weeks take one off and enter a new one. DTE must be at least 45-60 days away.
If strangles, close/roll at 21 DTE or 50% max profit whichever comes first. SL at 3x initial credit received.
1 Like
This is no one value. You need to look at past expiries straddle values at that particular time and similar DTE. For example, here are the cheapest straddle prices for NIFTY during January.
| Date | Time | Expiry | Strike Price | Call | Put | Straddle | DTE |
|---|---|---|---|---|---|---|---|
| 2025-01-01 | 09:20 | 2025-01-02 | 23700.0 | 105.75 | 131.65 | 237.40 | 1 DTE |
| 2025-01-02 | 09:20 | 2025-01-02 | 23800.0 | 111.10 | 116.50 | 227.60 | 0 DTE |
| 2025-01-03 | 09:20 | 2025-01-09 | 24200.0 | 166.35 | 198.80 | 365.15 | 6 DTE |
| 2025-01-06 | 09:20 | 2025-01-09 | 24000.0 | 159.60 | 139.35 | 298.95 | 3 DTE |
| 2025-01-07 | 09:20 | 2025-01-09 | 23750.0 | 164.15 | 167.50 | 331.65 | 2 DTE |
| 2025-01-08 | 09:20 | 2025-01-09 | 23700.0 | 87.45 | 120.00 | 207.45 | 1 DTE |
| 2025-01-09 | 09:20 | 2025-01-09 | 23600.0 | 55.15 | 49.30 | 104.45 | 0 DTE |
| 2025-01-10 | 09:20 | 2025-01-16 | 23600.0 | 162.00 | 187.45 | 349.45 | 6 DTE |
| 2025-01-13 | 09:20 | 2025-01-16 | 23300.0 | 144.10 | 195.05 | 339.15 | 3 DTE |
| 2025-01-14 | 09:20 | 2025-01-16 | 23250.0 | 103.45 | 120.45 | 223.90 | 2 DTE |
| 2025-01-15 | 09:20 | 2025-01-16 | 23250.0 | 75.50 | 80.30 | 155.80 | 1 DTE |
| 2025-01-16 | 09:20 | 2025-01-16 | 23300.0 | 52.35 | 28.95 | 81.30 | 0 DTE |
| 2025-01-17 | 09:20 | 2025-01-23 | 23250.0 | 160.85 | 201.80 | 362.65 | 6 DTE |
| 2025-01-20 | 09:20 | 2025-01-23 | 23300.0 | 137.85 | 192.20 | 330.05 | 3 DTE |
| 2025-01-21 | 09:20 | 2025-01-23 | 23400.0 | 128.05 | 129.85 | 257.90 | 2 DTE |
| 2025-01-22 | 09:20 | 2025-01-23 | 23150.0 | 96.20 | 130.25 | 226.45 | 1 DTE |
| 2025-01-23 | 09:20 | 2025-01-23 | 23100.0 | 58.60 | 39.35 | 97.95 | 0 DTE |
| 2025-01-24 | 09:20 | 2025-01-30 | 23350.0 | 159.65 | 218.45 | 378.10 | 6 DTE |
| 2025-01-27 | 09:20 | 2025-01-30 | 22950.0 | 163.35 | 183.70 | 347.05 | 3 DTE |
| 2025-01-28 | 09:20 | 2025-01-30 | 22950.0 | 146.95 | 141.30 | 288.25 | 2 DTE |
| 2025-01-29 | 09:20 | 2025-01-30 | 23050.0 | 127.70 | 132.70 | 260.40 | 1 DTE |
| 2025-01-30 | 09:20 | 2025-01-30 | 23150.0 | 133.95 | 129.15 | 263.10 | 0 DTE |
| 2025-01-31 | 09:20 | 2025-02-06 | 23400.0 | 295.85 | 343.45 | 639.30 | 6 DTE |
People can interpret it in different ways. But one clearly see that the straddle was overvalued on Jan 30 and 31, because of budget day ahead. When straddle is overvalued, it can be a good day to do a short straddle or ironfly.
Similarly, the straddle on Jan 16 was undervalued, which means it was a good day to do a long straddle.
For indices with weekly expiry, you can find a lot of data points from the past to compare. For stocks with monthly expiry, generally 6-12 months is what I do. Regardless, the price of the underlying should be similar for comparison to work.
Note: I am counting Friday options as 6 DTE because I am counting Sat and Sun as well. But it can be argued that it is actually 4 DTE. Either works, just be consistent.
1 Like
Hi! ![]() Thanks for your reply and help!
Thanks for your reply and help! ![]()
Could you please let me know which tool ![]() you’re using to track this?
you’re using to track this? ![]()
![]()
Thanks for your feedback! ![]()
I had a nightmare experience ![]() with selling strangles 45-60 days in advance.
with selling strangles 45-60 days in advance.
![]() On 16th Dec 2024, I sold a 22500 PE & 26000 CE strangle for the 30th Jan 2025 expiry.
On 16th Dec 2024, I sold a 22500 PE & 26000 CE strangle for the 30th Jan 2025 expiry.
![]() The CALL side worked out fine, but the PUT side was a complete disaster
The CALL side worked out fine, but the PUT side was a complete disaster ![]() .
.
![]() Sold the PUT at INR 31, but then the market tanked hard
Sold the PUT at INR 31, but then the market tanked hard ![]()
![]() .
.
![]() The premium shot up to INR 90 in some days!
The premium shot up to INR 90 in some days! ![]()
![]() The next day, it cooled off to INR 30, sometimes even INR 20, showing some profit
The next day, it cooled off to INR 30, sometimes even INR 20, showing some profit ![]() .
.
![]() But the volatility was insane—eventually, I exited on 27th Jan at INR 39.75, taking a loss.
But the volatility was insane—eventually, I exited on 27th Jan at INR 39.75, taking a loss.
![]() Had I held my nerves, I would have profited by expiry on the PUT side.
Had I held my nerves, I would have profited by expiry on the PUT side.
![]() My biggest issue with this strategy is the emotional rollercoaster ride!
My biggest issue with this strategy is the emotional rollercoaster ride! ![]()
![]() How do you handle this kind of stress? Any tips for managing the swings?
How do you handle this kind of stress? Any tips for managing the swings? ![]()
1 Like
No tool actually. I bought the data myself and wrote a python bot to backtest common option strategies.
1 Like
Sticking to proven mechanics and capital allocation would generate consistent profits over time. ![]() You will take some rare extreme losses when VIX is low, i.e., in its lull state and expands. This is why you should stick to 25-30% capital allocation during low VIX conditions, so you have sufficient capital to deploy during the high VIX conditions.
You will take some rare extreme losses when VIX is low, i.e., in its lull state and expands. This is why you should stick to 25-30% capital allocation during low VIX conditions, so you have sufficient capital to deploy during the high VIX conditions.
Think of it like this, if you have a 50-50 stock-option portfolio allocation, when the market rallies and VIX is low you make good money on the long stocks and less on selling options. When market tanks and the long stocks are not doing good, you make good money selling options.
Option selling as per Tasty mechanics is a mechanical process with no need to think or overcomplicate things. ![]()
Tom King on YT shares a no adjustment strategy:

just one question. Suppose I want to compare the 20th Feb expiry straddle price is cheap/expensive. So with which expiry I have to compare it?
You can compare with any expiry as long as the underlying is in a similar range and DTE (days to expiry) is same. So the current (17 Feb, 01:15PM) straddle price for 20th Feb expiry should be compared with the straddle price of 13 Feb expiry on 10th Feb at 01:15PM or with the straddle price of 06 Feb expiry on 3rd Feb at 01:15PM. And since NIFTY has been in the 20-26k range for a year, you can use any expiry in the past year for comparision as long as as DTE is same.