A tiny open source algorithmic trading platform for Nifty F&O
Option Buying & Selling support
No Indicators, pure price action, pivots and candle/chart patterns based
Built on Zerodha Connect API
Flexible and adoptable config based control for premiums, risk, rules etc
Released on MIT license
Available at Github - open-algo-zerodha-nifty I hope it will help who wants to monitor and trade without manual effort as system does takes care of everything automatically based on predefined rules and make profits for you !!
Key Features
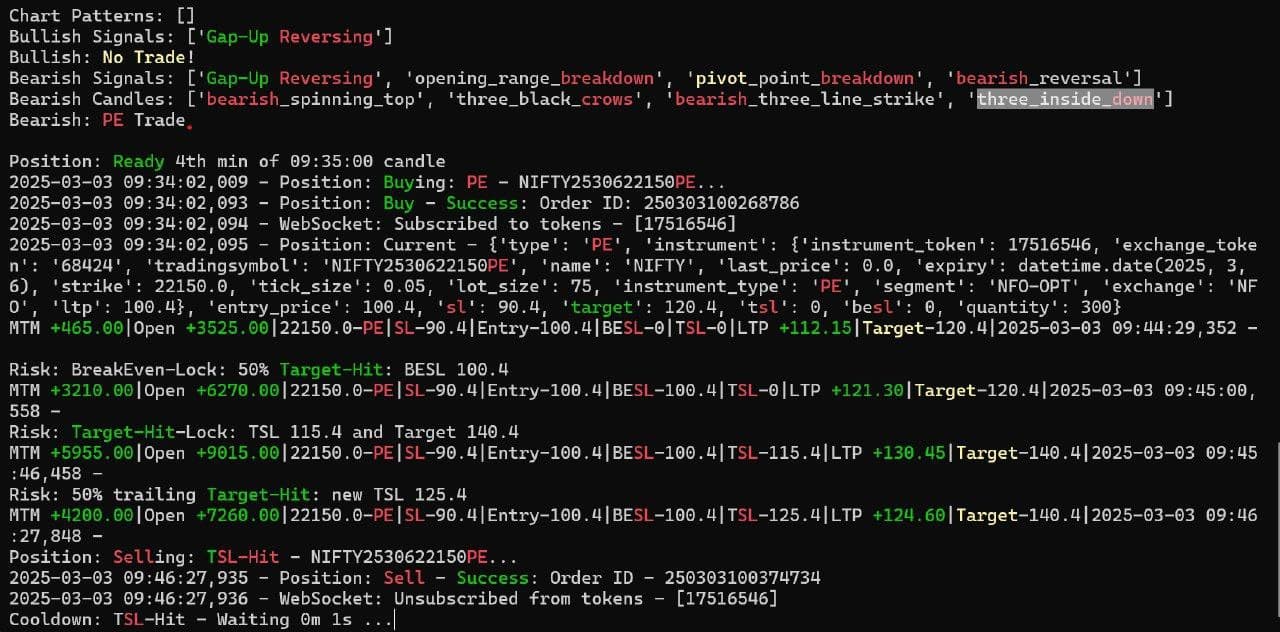
50+ candlestick/chart pattern detection
Config-driven risk management
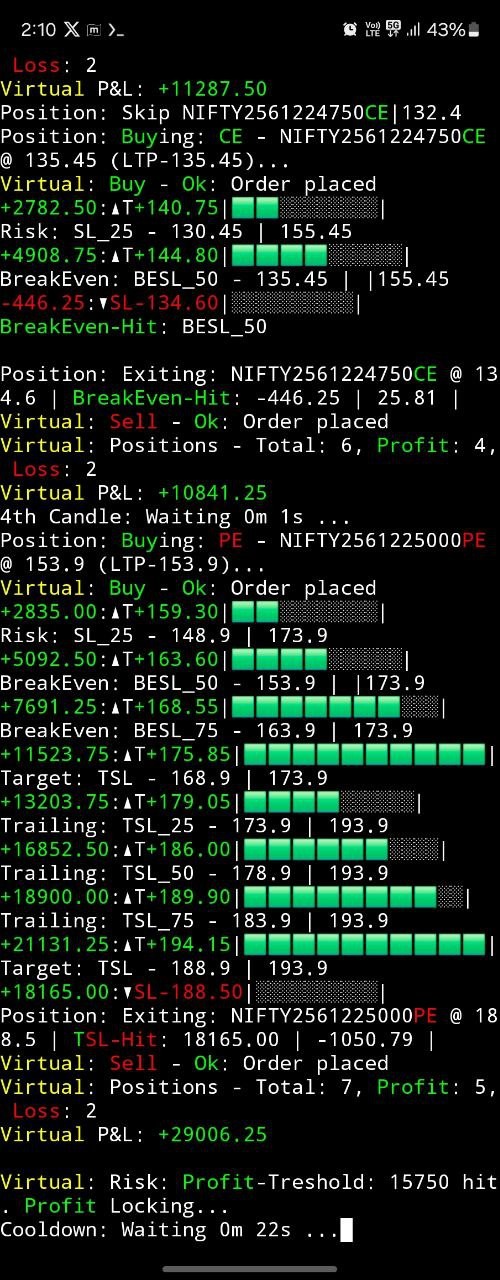
Virtual trading environment
Automated position management
Real-time Telegram notifications
Feel free to use it for your intra trading for Nifty F&O buying and selling. You can find all the design, architecture and usage details in GitHub.
On your GitHub, you have posted a snapshot of the strategy backtest showing an average daily profit of ₹17,345. Under the Configuration Management → Structure—you have set the lot size to 300.
Assuming the backtest is based on this lot size, selling 300 lots would require approximately ₹6 crore. With a daily profit of ₹17,345, this translates to an annualized return of around 10% (± 0.5%). If we were to include trading costs, the actual return would be much lower, roughly comparable to a fixed deposit.
Have I misunderstood anything related to the backtest or any other aspect? If yes, please clarify
I noticed a discrepancy in the trade analysis report for 17th February. Under the summary statistics it states:
Total trades: 11
Winning trades: 4
Losing trades: 3
Based on this breakdown, the total number of trades should be 7 ? Also the win rate is shown as 36.36%, and under the trades section, only 4 trades are displayed.
Could you please clarify why these figures don’t seem to align?
Probably breakeven.
Exact breakeven trades are rare in live trading due to expenses.
So it seems code doesn’t estimate expenses and slippages, which is a big flaw and will make numbers ( both returns and DD) look better. Better to fix that before starting to trade.
Please make use of code to trade on behalf of you based on your defined rules without even monitoring the market.
Do not worry about the report data or break even etc as these as per my style, feel free to change and back test yourself to fit for you. Also, here I’m not calculating any expenses etc as at least I should get first out if trade goes opposite after few points captured.
I request you to concentrate more about platform how it will be useful for you, rest of the stuff is just a add on which you need to take care of.
Note: As this is open sourced, I am providing it as it is.
yes yes, that’s all fine and quite generous from you. People can use it as needed and build on top of it.
I have my own stuff and i dont trade options anyway.
Just saying that expenses and slippages do make a decent impact on equity curve generally, so anyone backtesting should try to estimate it. Slippages one can estimate from real data, after executing for a while, by measuring difference between ideal price and actual price in tradelog. Multiplying expenses by 2x can be a good start but i dunno about options.