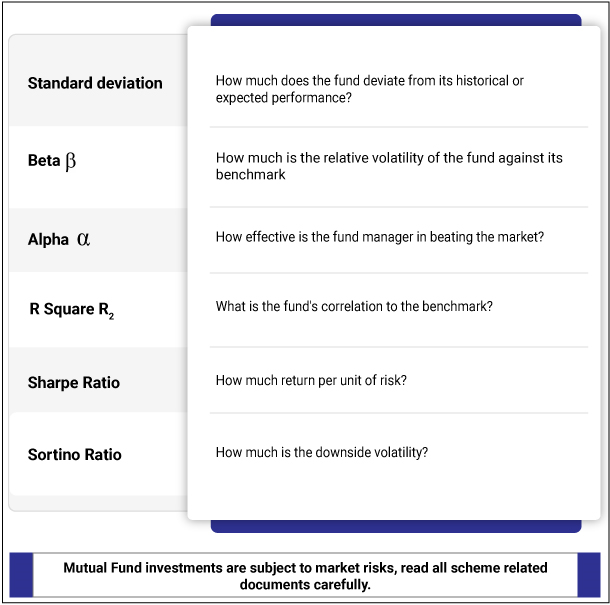
When assessing a mutual fund to invest in, it would help to understand the returns not in isolation but in comparison to the benchmark index. The risk-reward tradeoff can be measured through certain risk indicators. Through this article, let’s understand the six main indicators of investment risk in mutual fund portfolios. They are alpha, beta, r-squared, standard deviation, Sharpe ratio and the Sortino ratio. Let’s explore the key questions answered by these risk measures about the mutual fund performance:
- Standard Deviation
Standard Deviation is a statistical measure that captures the volatility or the riskiness of the fund. It measures the dispersion of returns from its mean. In simple words, it is the deviation of the fund from its expected or average returns. The standard deviation captures the returns during market ups & downs and presents it as an annualized number. As a general rule, the higher the standard deviation, the greater the volatility in the Mutual Fund returns on a historical basis. Typically, equity mutual funds have a higher standard deviation than debt Mutual Funds. Even within Equity Mutual Funds, thematic, sectoral, or small-cap funds would have a higher standard deviation than the large-cap or index funds.
Consider this with an example; if a mutual fund A has an average return of 10% and a standard deviation of 2%, this means that it may give returns between 8-12%.
- Beta
Beta is the relative volatility of the mutual fund against its benchmark. It is the tendency of a fund’s returns to respond to market swings. The default beta of the benchmark is 1. Index Funds have a beta of 1 since the fund moves in line with the benchmark.
Beta is the relative measure and does not give the inherent risk of the fund. If you are a conservative investor, you can use a low beta (less than 1) mutual fund portfolio that moves in line with the benchmark. For a mutual fund portfolio with Beta greater than 1, it indicates that it is more volatile than the market. However, you cannot solely rely on Beta values when selecting a mutual fund. Alpha and Beta values are generally used together.
Let’s consider the example of a mutual fund X with a Beta value of 0.8. This means that for every rise or fall of 1 in the benchmark index, the value of mutual fund X may fall by 0.8. If you are a conservative investor, you must look for a mutual fund with a lower beta value.
- Alpha
Alpha is a measure of how much relative return does a mutual fund earn in comparison to its benchmark. It is used to measure active mutual funds. Alpha helps you to gauge the fund manager’s ability to beat the benchmark returns. It represents the value that the fund manager adds or subtracts from a portfolio’s return. An alpha of 1.5 means the fund has outperformed its benchmark index by 1.5%. Correspondingly, an alpha of -1.5 would indicate an underperformance of 1.5%. The investment returns in excess or relative to the return of the benchmark index is its alpha. It represents the performance that diverges from a portfolio’s beta
- R Squared
R Squared is the fund’s correlation to the benchmark which is on a scale of 100. An R-Square value of 100 signifies a perfectly correlated performance to the scheme. This is true for index funds. So if a fund has an R-Squared value close to or equal to 100, then it might be structured like an index. The majority of the funds have an R-squared value of over 80 to indicate a higher correlation with the benchmark index. An R-squared value less than 80 would indicate that the mutual fund does not perform like the benchmark index. Active funds will always have a lower R-squared value as it does not try to replicate the benchmark
- Sharpe Ratio
It is always recommended that you need to invest in a mutual fund that gives a good risk-adjusted return. Sharpe Ratio measures the risk-adjusted return in a mutual fund’s performance. Sharpe Ratio is used to characterize how well the return of an asset compensates the investor for the risk taken. It is calculated by subtracting the risk-free rate of returns from the fund manager’s returns and dividing the result by standard deviation. The greater a portfolio’s Sharpe ratio, the better its risk-adjusted performance has been.
Let’s understand this by comparing two funds.
Fund A generates a return of 12%, while fund B delivers a 10% return.
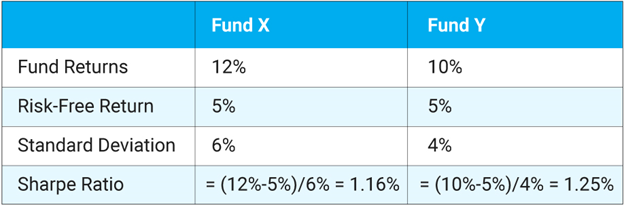
Prima facie, fund manager X has performed better than fund manager Y. But the Sharpe ratio of fund Y is better which means it can deliver a better risk-adjusted return.
Fund X’s Sharpe Ratio comes to 1.16% while fund Y’s Sharpe Ratio is 1.25%
This means that Fund Y delivered a better risk-adjusted return than Fund X. In other words, Fund Y, which has a higher Sharpe Ratio exhibits greater potential to earn more returns per unit of risk. However, the Sharpe ratio does not distinguish between bad and good volatility. When a mutual fund gives high returns, its standard deviation will also be high, indicating good volatility. However, when a scheme gives low returns, its standard deviation will again be high but this signals bad volatility. This is where Sortino Ratio comes into the picture.
- Sortino Ratio:
The Sortino Ratio determines the success of a fund in capping its downside volatility. Though this ratio is similar to the Sharpe Ratio in the sense that it subtracts the risk-free returns from the fund returns, the real difference is that it only uses the fund’s downside standard deviation in its calculations.
But instead of dividing it by the total standard deviation, it divides the difference with the downside standard deviation. A higher Sortino Ratio means a lower probability of downside deviation in the Mutual Fund scheme.
Let’s consider this by comparing the same two funds.
Fund A generates a return of 12%, while fund B delivers a 10% return.
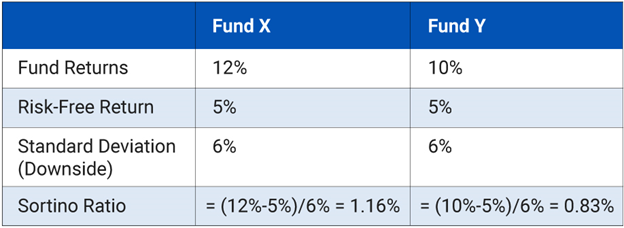
In the above example, Fund X has a higher Sortino ratio. This means that this fund is better equipped to protect the investor from market downsides.
Your risk profile will determine how you view a mutual fund’s performance through the lens of these different risk ratios. If you are a conservative investor, you can opt for short-duration funds in a debt mutual fund. If you are moderately conservative, you could opt for a long-duration debt mutual fund or a hybrid mutual fund. If you are open to taking aggressive options in investments, you can consider an equity mutual fund. These risk ratios will thereafter act as a measure to assess the risk-reward payout in your mutual fund investments.
Disclaimer: The views expressed here in this Article / Video are for general information and reading purpose only and do not constitute any guidelines and recommendations on any course of action to be followed by the reader. Quantum AMC / Quantum Mutual Fund is not guaranteeing / offering / communicating any indicative yield on investments made in the scheme(s). The views are not meant to serve as a professional guide / investment advice / intended to be an offer or solicitation for the purchase or sale of any financial product or instrument or mutual fund units for the reader. The Article / Video has been prepared on the basis of publicly available information, internally developed data and other sources believed to be reliable. Whilst no action has been solicited based upon the information provided herein, due care has been taken to ensure that the facts are accurate and views given are fair and reasonable as on date. Readers of the Article / Video should rely on information/data arising out of their own investigations and advised to seek independent professional advice and arrive at an informed decision before making any investments. None of the Quantum Advisors, Quantum AMC, Quantum Trustee or Quantum Mutual Fund, their Affiliates or Representative shall be liable for any direct, indirect, special, incidental, consequential, punitive or exemplary losses or damages including lost profits arising in any way on account of any action taken basis the data / information / views provided in the Article / video.
Mutual Fund investments are subject to market risks, read all scheme related documents carefully.