Hi,
On Kite -> Studies, there are RSI and Stochastic RSI Indicators available to plot beneath the candle chart. Howsoever we can customise them as per our requirement, we cannot apply a Moving Average line or a signal line as we can do in the case of MACD indicator.
InvestoPedia mentions that applying Moving Averages can help smooth the RSI and Stochastic RSI Indicators with respect to signals they generate.
Is there a way to plot a moving average line along with the RSI line?
Thanks,
Dev,
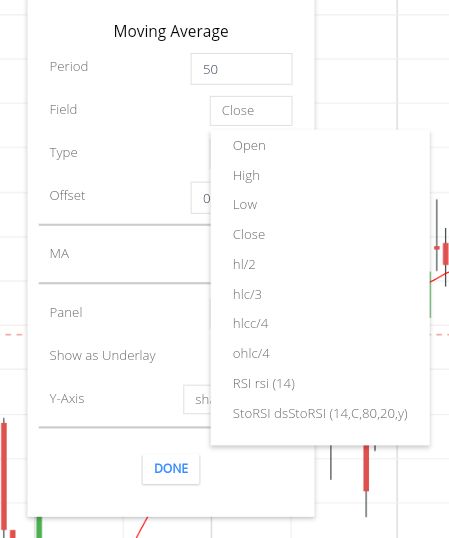
Yes, you can. On ChartIQ, once you’ve added the RSI and Stochastic RSI indicators, add Moving Average indicator, while adding this chose field as RSI/Stochastic RSI, and the MA will be plotted on these indicators.
@ShubhS9:
Thanks for your comment. I have seen those combinations on tradingview and wished I could find something similar on Kite (Zerodha) as that would eliminate the need for switching to other screen / window,
I found ChartIQ interesting. Thanks for mentioning it. However, it seems they don’t have Indian exchanges data / Indian stocks in their Stock Search.
ChartIQ charts are available on Kite, the above screenshot is of the same. Here’s how you can switch charts on Kite
@ShubhS9:
Thanks, buddy! I had seen those options on Profile page but was under the impression that they could be some sort of theme.
Thanks again for pointing me into the correct direction.
1 Like
You can check Tradingview to add a moving average line along with the RSI line.