I have tried to work on the SAIL Chart. Anyone have experience please check and rectify the error I made. Thanks in advance

Good attempt @Sahil6973
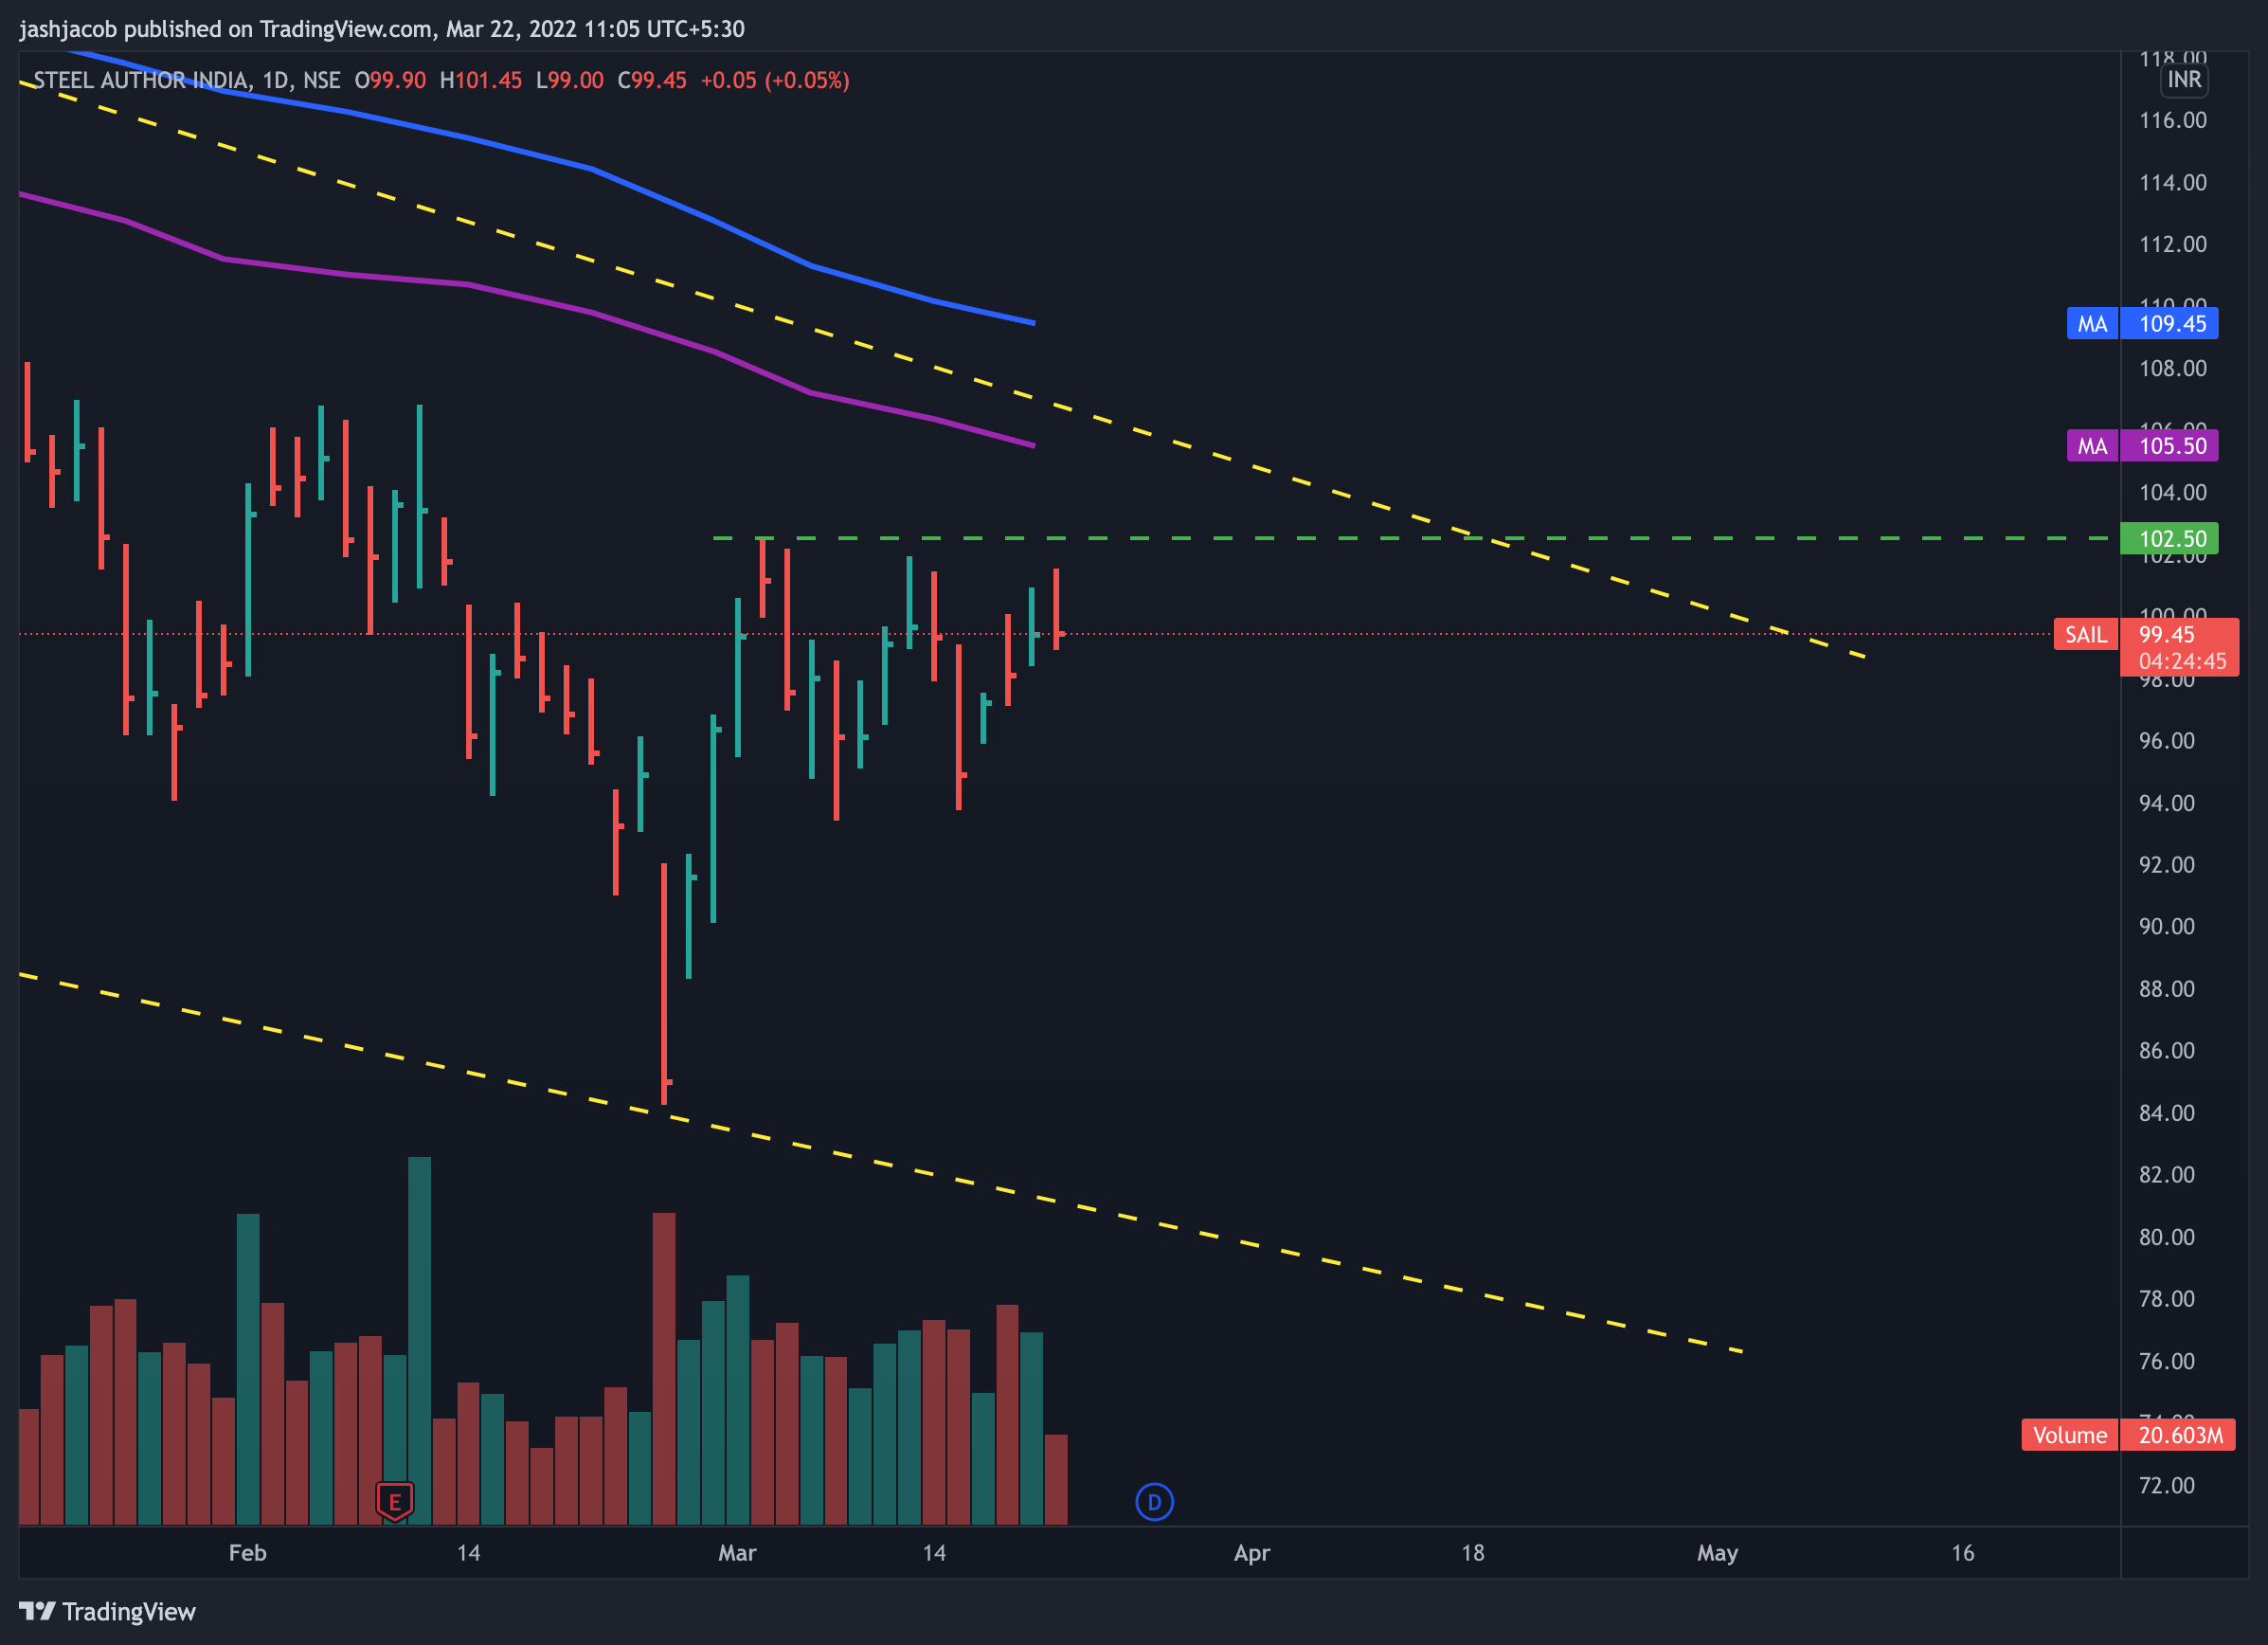
You can also plot the trendline using the wick of the candle taking from 24th Feb’s bottom and 10th febs top …that would also give u similar result but may show more accurate results.
Keep up the great work and do share charts here regularly. The stock pick is also pretty good 

1 Like
Price is wedging up nicely in the daily time frame. Range tightness in the last couple of days, with right cues it may shoot.
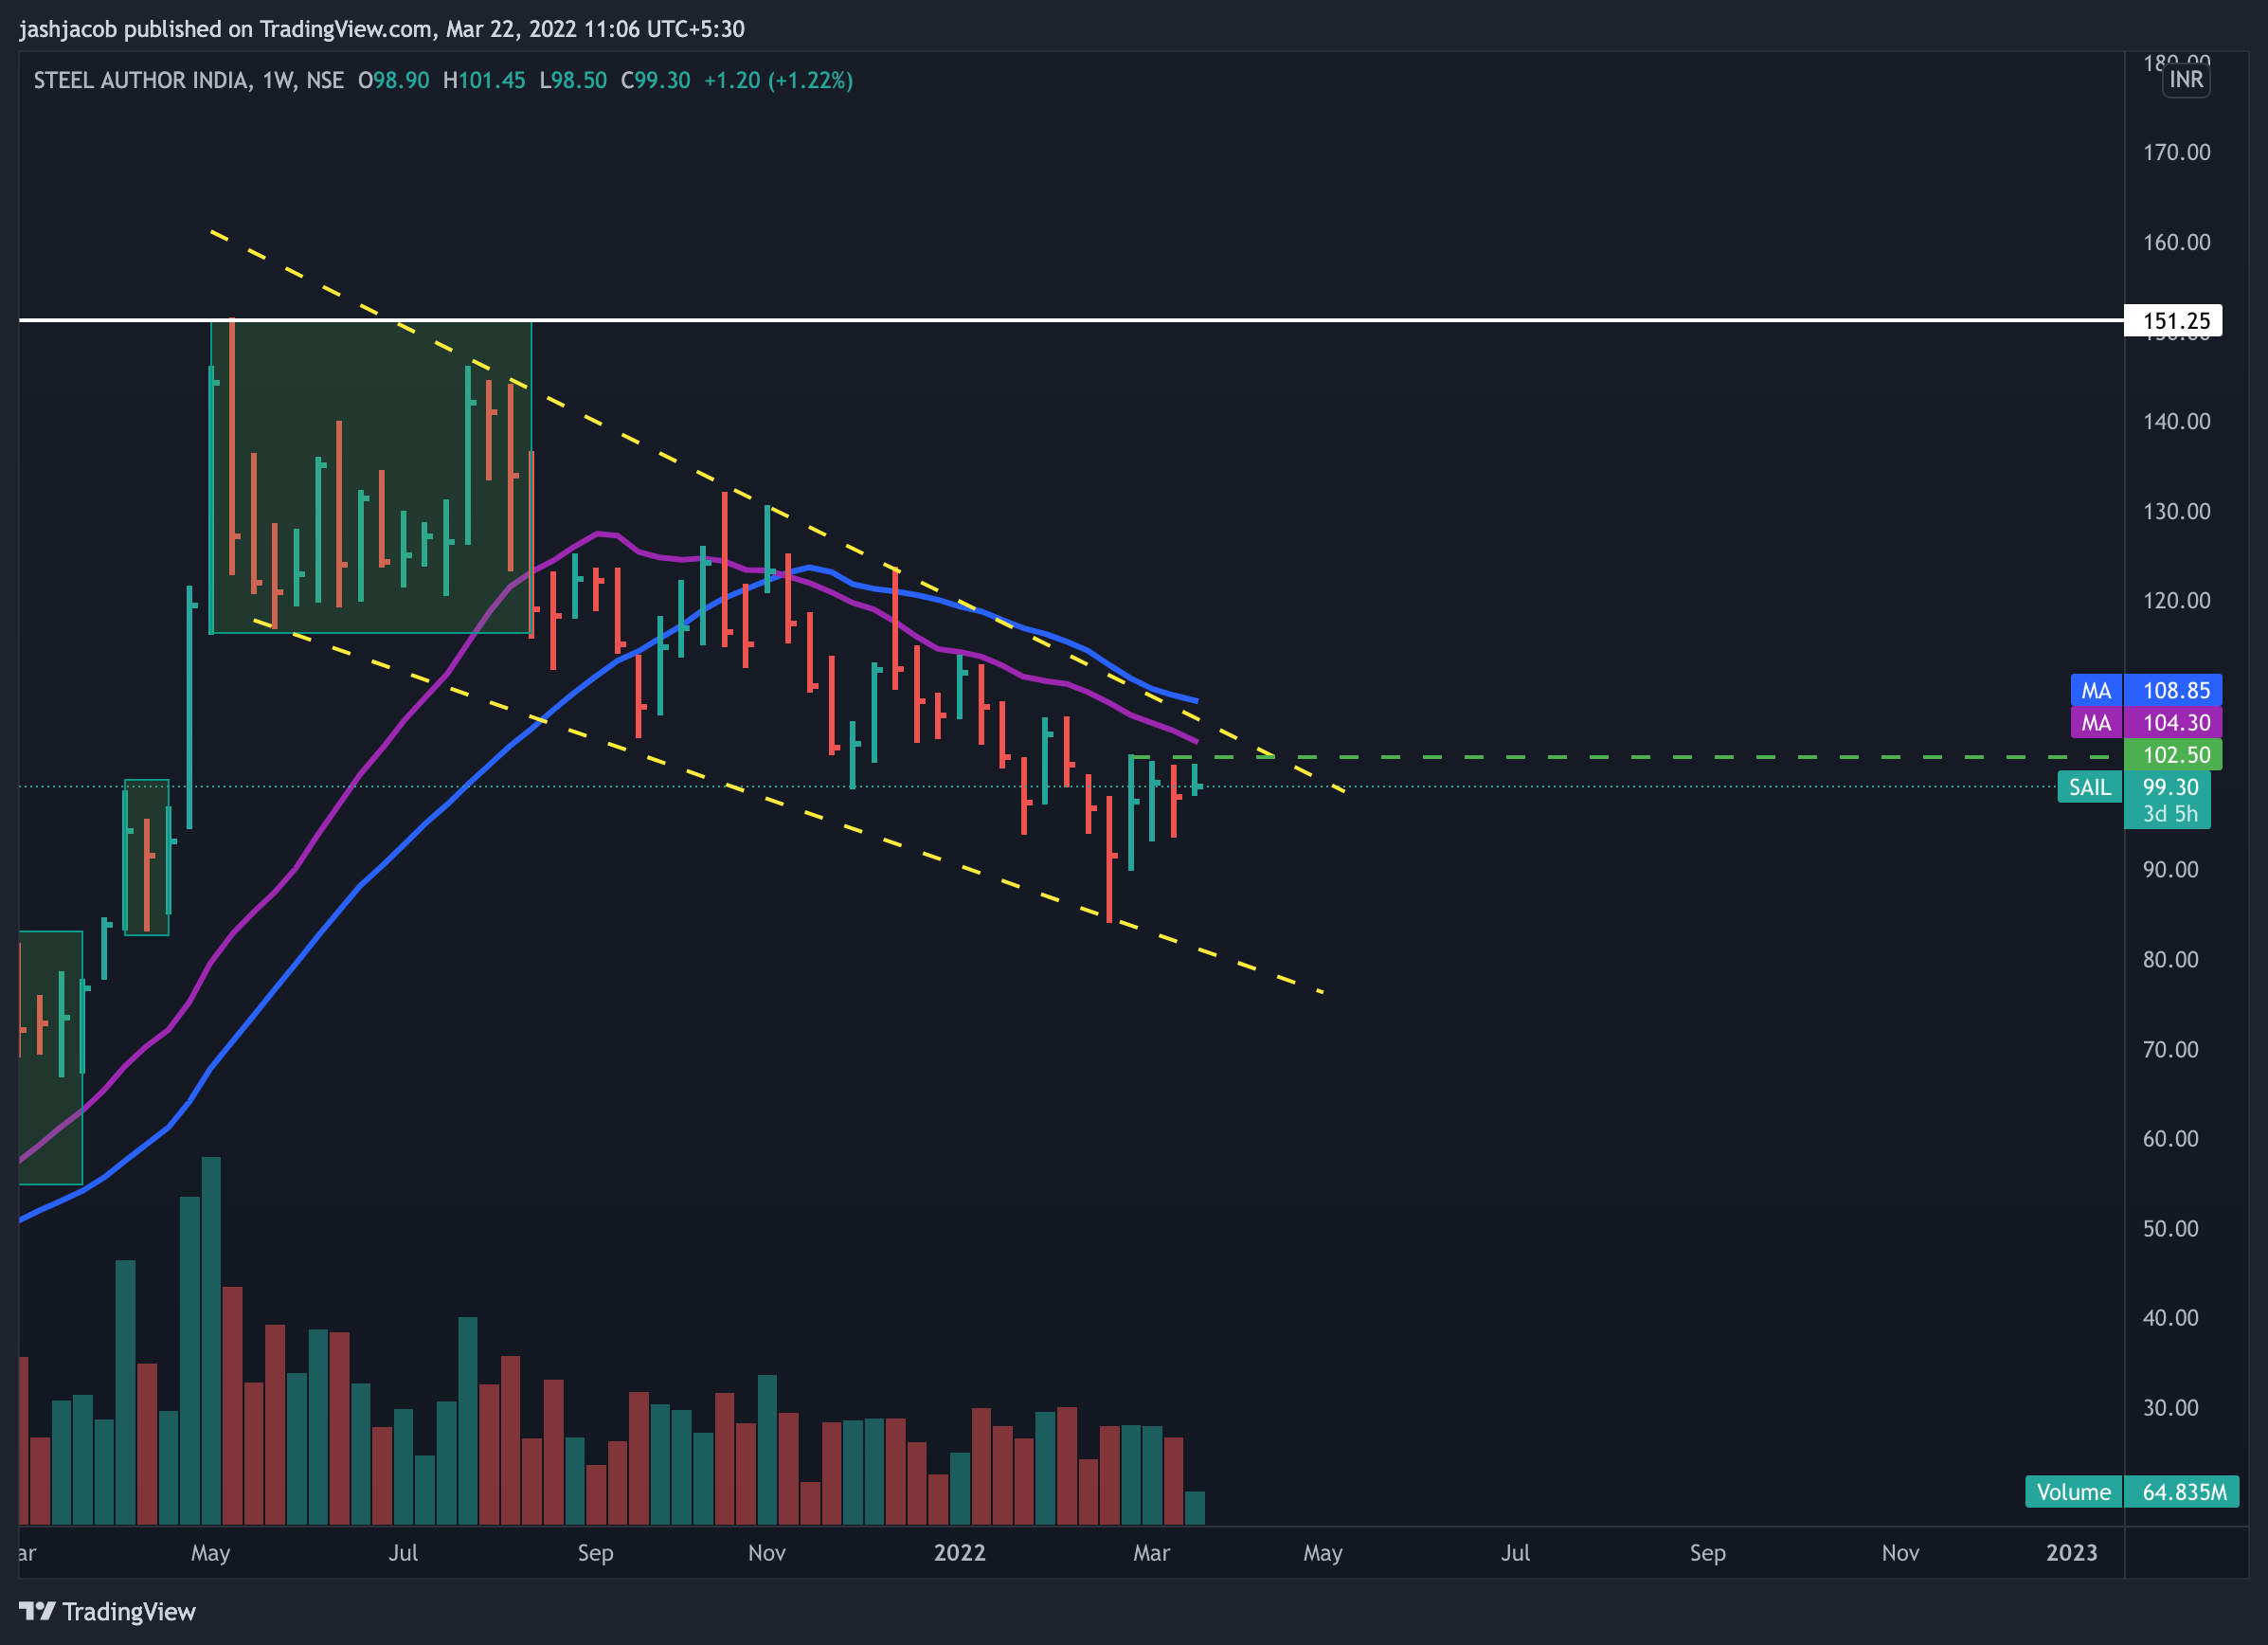
We are still in a structural downtrend in weekly.
1 Like
if you don’t mind, can you tell why you use bars instead of candlesticks?
I use bars and I turn off Open price with the HLC setting in Trading View.
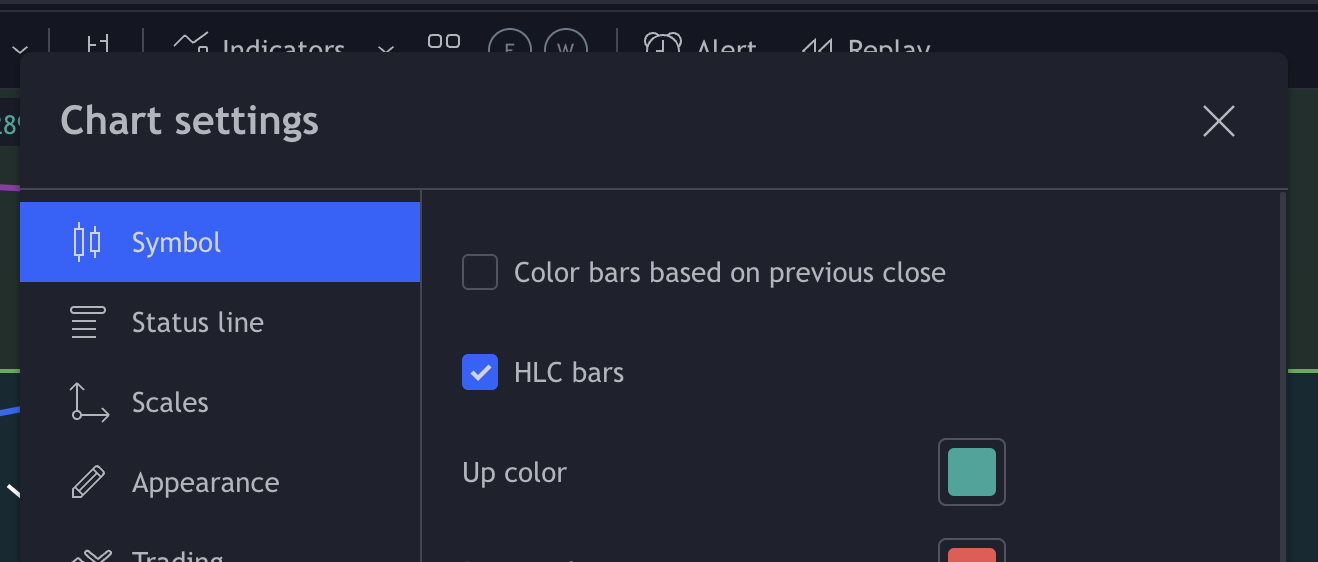
I basically disregard the price at which the scrip opened at any time frame. I only concern myself with High Low and Close.
I like to trade range tightness, weekly close price tightness, inside bar etc. For all these I look at close price of the scrip at various time frames to take my entry.
1 Like
Are you using these bars for more accuracy?
Thank you so much for your help and guidance.