SEBI Annual report 2017-18

Securities and Exchange Board of India has put up the Annual report for 2017-18.

Click here to view and download the report.

Understanding the economic and regulatory environment can definitely give an edge when it comes to trading and investing. This reports contains useful information & data regarding -

  • Trends in global economic growth
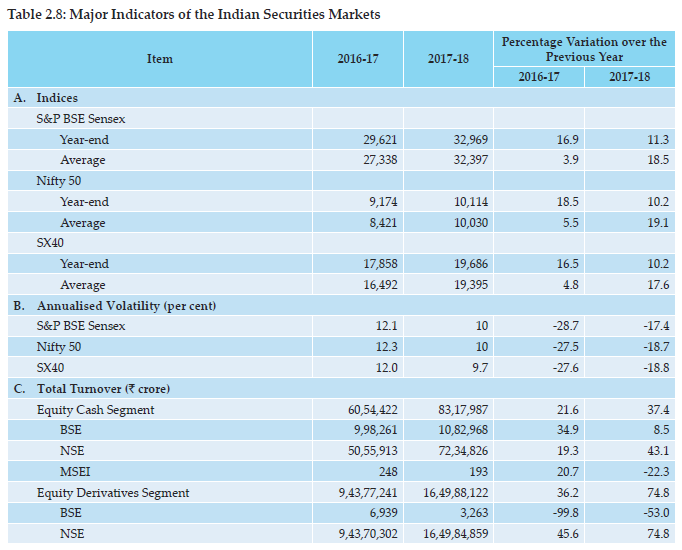
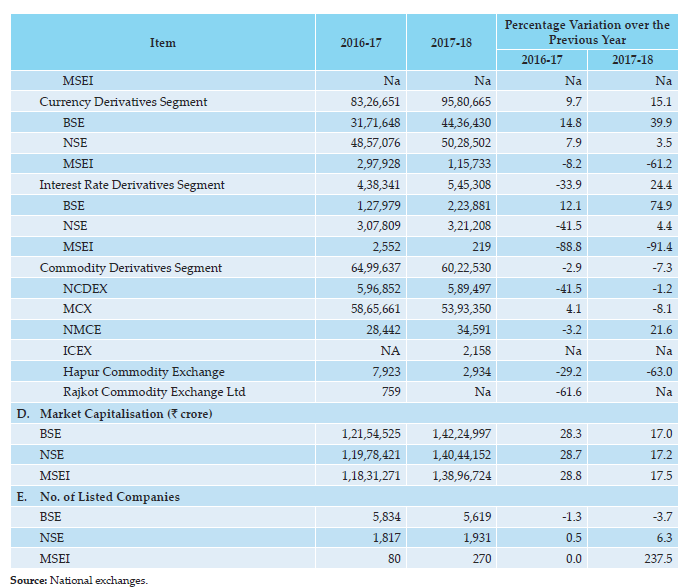
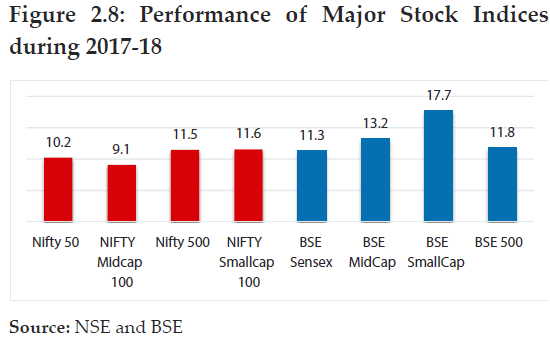
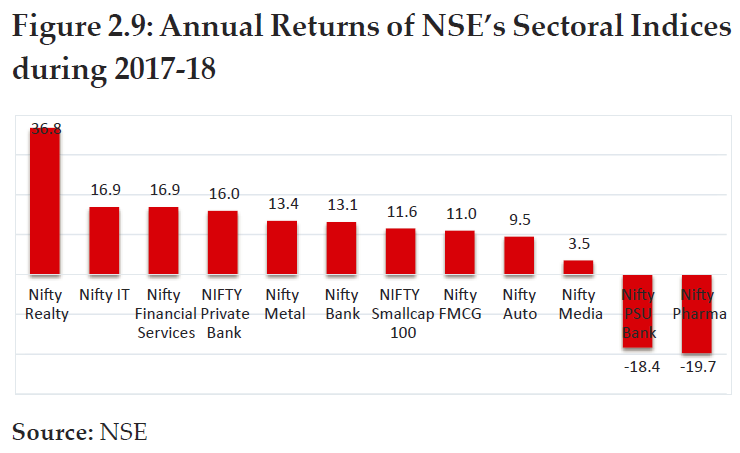
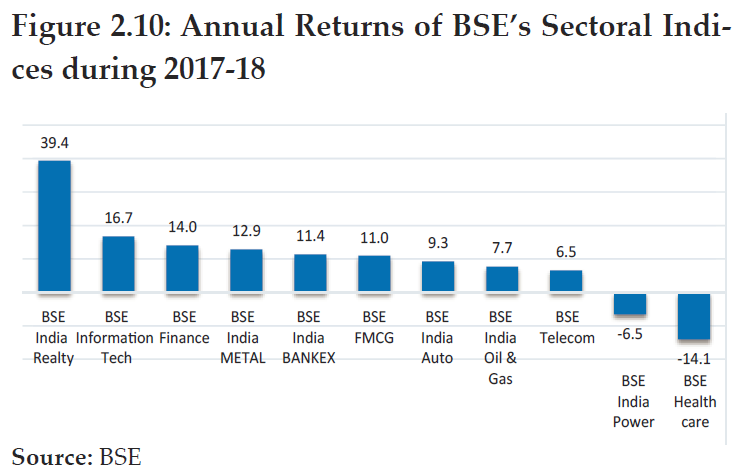
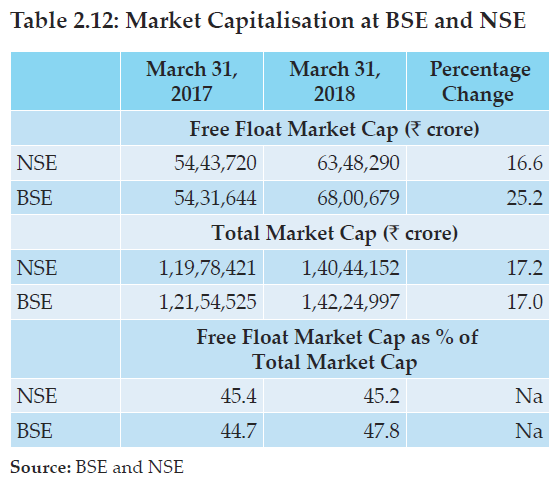
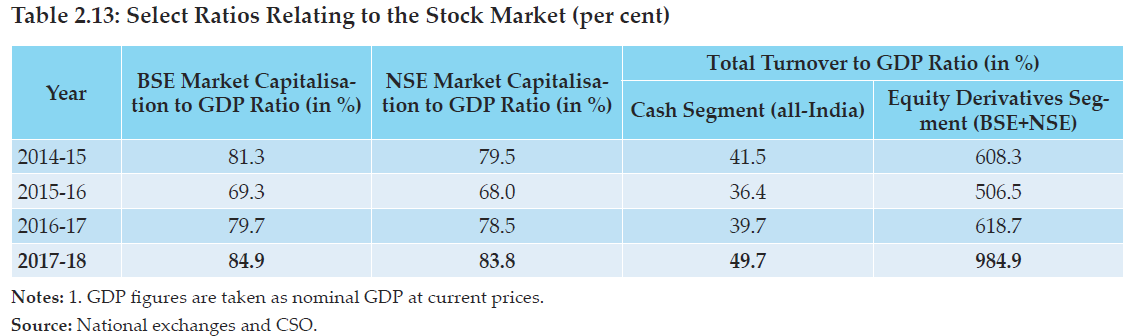
  • Major indicators in the Indian securities market,
  • Trends in the Index & Stock F&O markets,
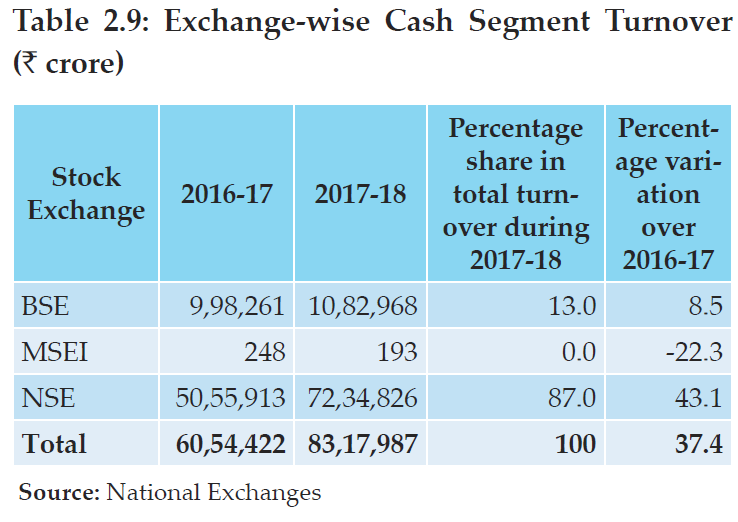
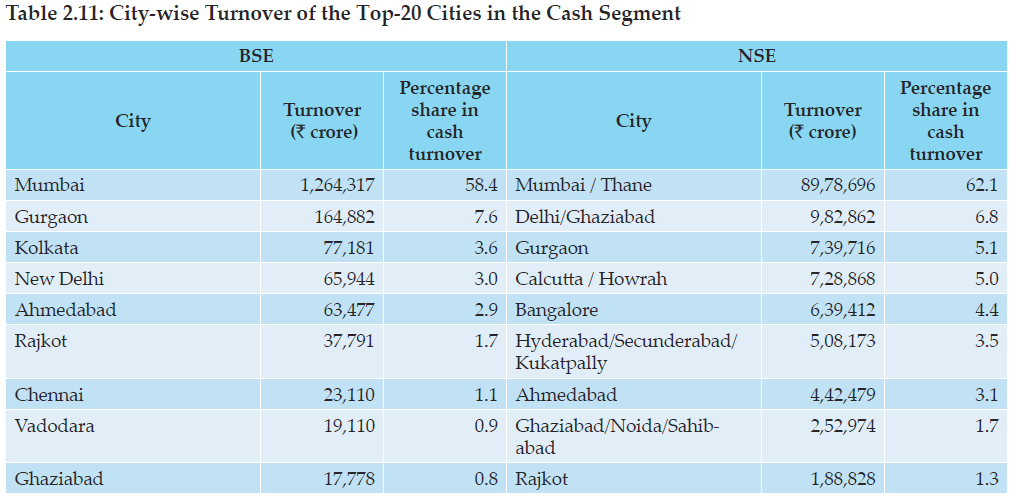
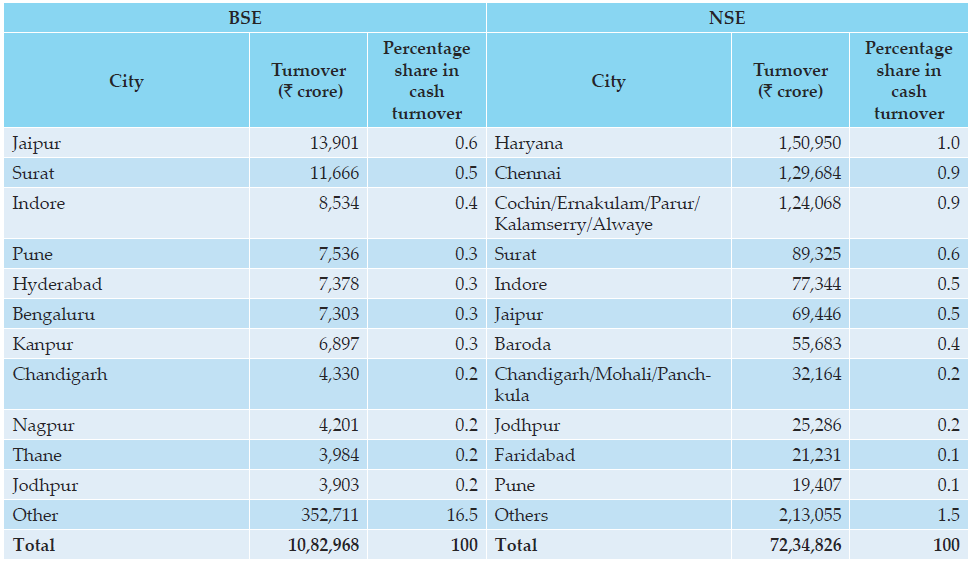
  • Trading statistics of Stock exchanges,
  • Trends in Mutual Fund resource mobilization & Transactions on Stock Exchanges

and more. You can check out page 21 on the report for the lit of box items i.e interesting nuggets of data represented visually. Some important and relevant aspects i’ve summarized in the posts below -

Overall Economy

  • As per the annual data for 2017 published by World Federation of Stock Exchanges (WFE), NSE is placed at first position in the World in index options and at second position in stock futures, when ranked in terms of the number of contracts traded

  • According to IMF projections, the Indian economy is expected to grow at 7.4 per cent in 2018 and 7.8 per cent in 2019 which is significantly higher than the 6.7 per cent growth in 2017.

  • Growth trends by country - in terms of %

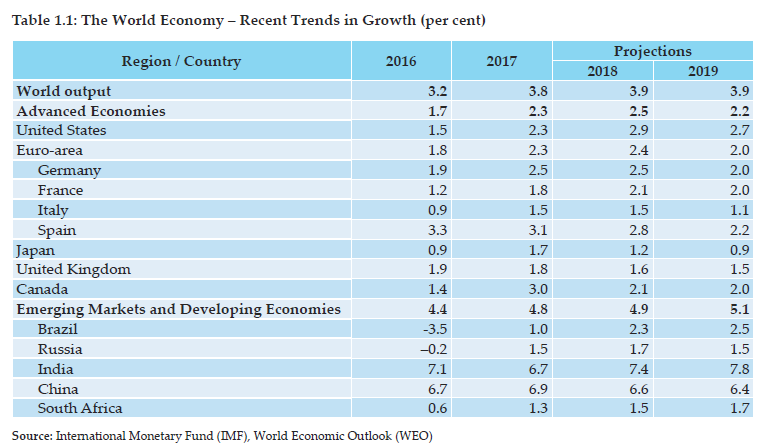
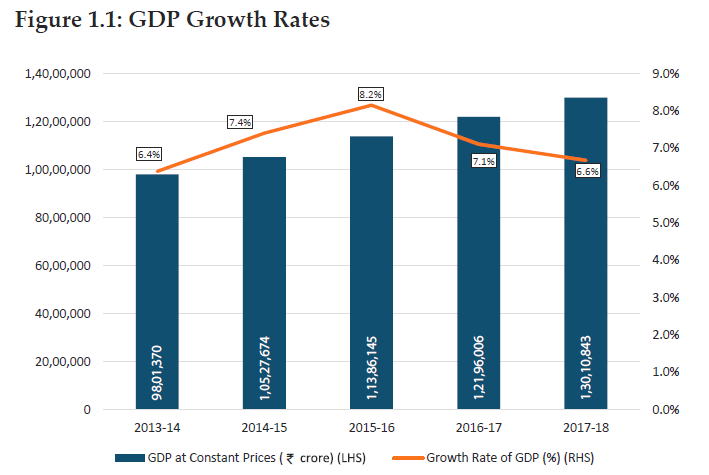
  • As per the Central Statistics Office’s (CSO’s) provisional estimates, the Indian economy grew by
    6.7 per cent during 2017-18 against a growth rate of 7.1 per cent during 2016-17. Economic Survey 2017-18 forecast that India may record real GDP growth in the range of 7.0 to 7.5 per cent in 2018-19

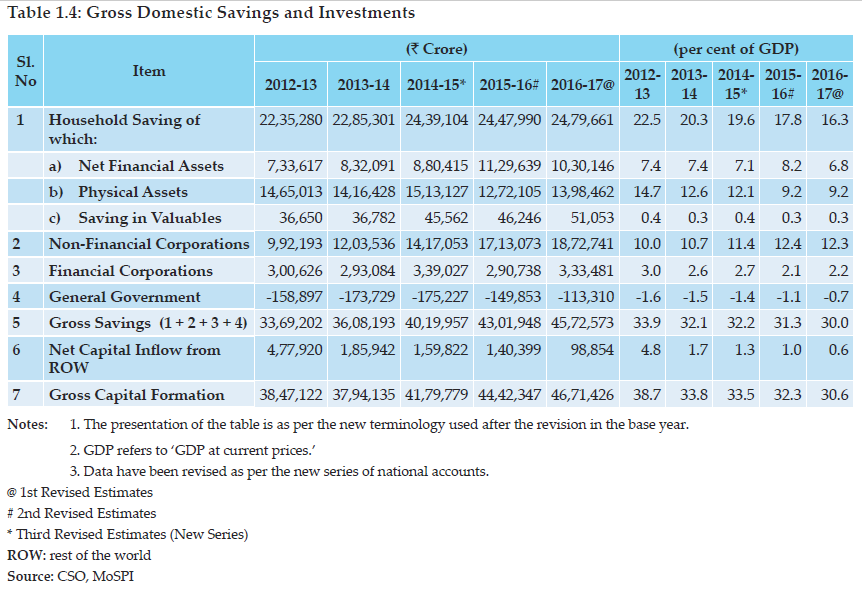
  • During 2016-17, gross saving is estimated at 45.7 lakh crore as compared to 43.0 lakh crore during corresponding previous year.

Others

  • Retail investors can now seek redressal where they have suffered an opportunity loss in an IPO due to SSCBs failure to make bids, process ASBA etc

  • SEBI revised provisions relating to Transfer of listed specified securities and decided that requests for effecting transfer of listed specified securities shall not be processed unless the securities are held in the dematerialized form with a depository.

  • Non-resident Indians (NRIs) have been permitted to participate in the exchange traded currency derivatives market to hedge the currency risk arising out of their investments in India. In this regard, guidelines with respect to trading by NRIs in exchange traded currency derivatives market and permissible position limits were specified.

Mutual Funds

  • SEBI issued guidelines to AMCs make additional disclosures of the name, designation and
    remuneration received by top ten employees in terms of remuneration drawn for that financial year.

  • IAF facility (which can be availed through online mechanism) that allows investors of Mutual Funds (MF) to access their funds invested in certain schemes, on the same day of redemption request.

  • To promote digitalization, MFs/AMCs have been allowed to accept investment by an investor through e-wallets (Prepaid Payment Instruments (PPIs)) subject to certain conditions.

  • Categorization and standardization of open ended schemes along with uniform description of a category across the fund houses.

  • Separate disclosure of TER on a daily basis on AMC website, Communication of any change in TER.

  • The MF industry saw gross resources mobilization of Rs 209.99 lakh crore during 2017-18 compared to Rs 176.16 lakh crore during 2016-17

  • AUM of MF industry was Rs 21.36 lakh crore at end of March 2018 compared to Rs 17.54 lakh crore at end of March 2017.

  • Increase in Government debt investment limits for FPIs

  • India’s broad-based benchmark indices S&P BSE Sensex and NIFTY 50 grew by 11.3 per cent and 10.2 per cent respectively during 2017-18 from their closing in the last financial year.

  • Market capitalisation of BSE and NSE expanded by 17.0 per cent and 17.2 per cent respectively at the end of March 2018 as compared to previous year

  • In the cash segment, the turnover at NSE and BSE increased substantially by 43.1 per cent and 8.5 per cent respectively, during the same time.

  • A total of Rs 1,10,269 crore was mobilised by issue of equity to the public during 2017-18, which was 77.5 per cent higher than the resource mobilised corresponding previous year.

  • During 2017-18, the net investment by the FPIs in the Indian market was Rs 1.5 lakh crore. In US$ terms, net investments during 2017-18 were US$ 22,618 million compared to net investments of US$ 7,177 million during the previous year.

Primary Markets

  • During the year, 31 IPOs out of 45 main board IPOs raised an amount of Rs 77,088 crore with an issue size of Rs 500 crore or more (with the largest issue being for Rs 11,176 crore).

  • Industry-wise Resource Mobilisation -

OFS -

image

Secondary Markets

  • Both Sensex and Nifty reached their respective all-time highs of 36,444 and 11,172 on January 29, 2018. The lowest level attained by the Sensex was 29,319 on April 18, 2017 while the NIFTY recorded its lowest level of 9,105 on April 19, 2017

  • In the cash segment, the turnover at NSE increased by 43.1 per cent during 2017-18 compared to 19.3 per cent growth in the previous year. The turnover of BSE too increased by 8.5 per cent during 2017- 18 compared to 34.9 per cent growth in the previous year.

  • In the equity derivatives segment too, the turnover at NSE witnessed spurt in the trading activity. The gross turnover at NSE rose by 74.8 per cent during 2017-18 compared to 45.6 per cent growth in the previous year. The trading activity of equity derivative segment of BSE, however, declined significantly. The gross turnover in the derivatives segment of BSE declined by 53 per cent during 2017-18, compared to decline of 99.8 per cent in the previous year.

  • The market capitalisation of BSE and NSE also witnessed a gain of 17.0 per cent and 17.2 per cent, respectively in 2017-18 over previous year

  • In terms of PE valuations, the PE ratio of Sensex and Nifty increased modestly to 22.7 and 24.7, respectively, at the end of March 2018 from 22.6 per cent and 24.3 per cent, respectively, at the end of March 2017.

  • The annualized volatility of the Sensex and Nifty registered 10.0 per cent in 2017-18 from 12.1 per cent and 12.3 per cent, respectively, in 2016-17

  • While the number of companies listed at BSE decreased to 5,619 at the end of March 2018 from 5,834 at the end of March 2017, the number of companies listed at NSE increased to 1,931 at the end of March 2018 from 1,817 at the end of March 2017.

Annual Returns of International Indices during 2017-18

  • Among the broad based indices at NSE, Nifty Small Cap index, NSE 500 index and Nifty Mid Cap index grew by 11.6 per cent, 11.5 per cent and 9.1 per cent respectively during 2017-18.

  • Similarly, the broadband indices at BSE viz. S&P BSE Small Cap index, S&P BSE Mid Cap index and S&P BSE 500 index rose by 17.7 per cent, 13.2 per cent and 11.8 per cent respectively during 2017-18.

  • Among the select sectoral indices at NSE, Nifty Realty Index gained highest (36.8 per cent) followed by Nifty IT Index & Nifty Financial Services (16.9 per cent), Nifty Private Bank (16 per cent), Nifty Metal Index (13.4 per cent) and Nifty Bank Index (13.2 per cent).

  • On the other hand, NSE’s Nifty Pharma Index and Nifty PSU Bank Index were decreased by 19.7 per cent and 18.4 per cent respectively during 2017-18.

image

  • The turnover of all stock exchanges in the cash segment increased by 37.4 per cent to Rs 83.2 lakh crore in 2017-18 from Rs 60.5 lakh crore in the previous year.

  • Trading data for the top-20 cities in India shows that 58.6 per cent of BSE’s total turnover in the equity cash segment and 62.1 per cent of NSE’s total turnover in the equity cash segment was concentrated in Mumbai.

  • The total market capitalisation at BSE and NSE increased by 17.0 per cent and 17.2 per cent respectively to Rs 142.2 lakh and Rs 140.4 lakh crore at the end of 2017-18.

image

Stock Market Indicators

  • Market capitalisation to GDP ratio provides an overview of developments in stock markets vis-à-vis growth in the economy. It measures the size of the stock market relative to the economy. After a plunge in 2015-16, market cap to GDP ratio increased significantly during 2016-17 and 2017-18.

  • The BSE’s market capitalisation to GDP ratio increased from 79.7 per cent in 2016-17 to 84.9 per cent in 2017-18. Similarly, the NSE ratio increased from 78.5 per cent in 2016-17 to 83.8 per cent in 2017-18

  • As on March 31, 2018, BSE S&P Sensex and NIFTY TY 50’s P/E ratios were 22.7 and 24.7 respectively as compared to 22.6 and 23.3 respectively on March 31, 2017

  • The volatility in the Indian equity markets further subsided during 2017-18. India’s volatility index (India VIX), which indicates investors’ perceptions of the market’s volatility in the next 30 calendar days, closed at 15.8 at the end of March 2018 compared to 12.4 at the end of March 2017.

  • During 2017-18, the S&P BSE Small cap recorded a highest volatility of 15.6 per cent, followed by Nifty Next 50 (13.5 per cent)

  • Annualized volatility of the Sensex, decreased to 10 per cent in 2017-18 from 12.3 per cent in the previous year. A similar trend was observed for NIFTY which moved down from 12.3 per cent to 10 per cent in 2017-18.