2. Official BSE Sensex Index Formula
Closing value of the index ≠ VWAP of the index itself.
It is calculated by recomputing the index using the official closing prices of each constituent stock, where each stock’s closing price is determined using the exchange’s closing-price methodology.
                Σ ( Closing Priceᵢ × Shares Outstandingᵢ × IWFᵢ )
Index  =  ──────────────────────────────────────────────────────
                                  Divisor
where:
- Closing Priceᵢ = official BSE closing price of constituent i
- Shares Outstandingᵢ = total listed shares
- IWFᵢ = Investible Weight Factor (free-float factor)
- Divisor = index divisor maintained by BSE to preserve continuity after corporate actions
Summed over all 30 Sensex constituents.
3. Data Needed for the EXACT Formula
| # |
Input |
Count |
Public? |
| 1 |
Official BSE closing price |
30 |
 yes yes |
| 2 |
Shares outstanding |
30 |
yes |
| 3 |
IWF |
30 |
 proprietary/Not Published proprietary/Not Published |
| 4 |
Divisor |
1 |
proprietary/Not Published |
 Blockers: IWF and Divisor aren’t published by BSE — so the exact formula can’t be run directly from public data.
4. The Workaround (ratio / return method)
Since IWFᵢ, Shares Outstandingᵢ, and the Divisor are all identical today and yesterday (no corporate action overnight), write the formula for both days and divide:
Index_today       Σ ( Priceᵢ,today × Shares Outstandingᵢ × IWFᵢ )
────────────  =  ──────────────────────────────────────────────      ← Divisor cancels
Index_yest        Σ ( Priceᵢ,yest  × Shares Outstandingᵢ × IWFᵢ )
Since each stock’s weight already equals (Priceᵢ × Shares Outstandingᵢ × IWFᵢ) ÷ Total Free-Float Market Cap, this reduces to:
┌──────────────────────────────────────────────────────────────────┐
│                                      ⎛           Price_today ⎞     │
│  Index_today = Index_yesterday ×  Σ ⎜ weightᵢ × ─────────── ⎟     │
│                                      ⎝           Price_yest  ⎠     │
└──────────────────────────────────────────────────────────────────┘
No IWF, no Shares Outstanding, no Divisor needed — all baked into the weights.
Data needed for the workaround
| # |
Input |
Count |
Have it? |
| 1 |
Yesterday’s Sensex close (anchor) |
1 |
|
| 2 |
Each stock’s weight |
30 |
|
| 3 |
Each stock’s price yesterday |
30 |
|
| 4 |
Each stock’s price today |
30 |
|
5. The Data (your latest ranked weightage)
Getting the weightage also took me a lot of time. I searched everywhere but couldn’t find the official data. So, I ultimately reconstructed it from the Nippon India ETF BSE Sensex portfolio dated 30 June 2026. It holds all 30 constituents in index proportions, plus 0.39% cash. I removed the cash and renormalized the weight of every stock.
Anchor: 22-Jul-2026 Sensex close = 76,755.05
| # |
Stock |
Weight % |
22-Jul Close ₹ |
23-Jul Close ₹ |
Change % |
| 1 |
HDFCBANK |
13.42 |
753.15 |
748.00 |
−0.68 |
| 2 |
ICICIBANK |
10.88 |
1,441.00 |
1,433.95 |
−0.49 |
| 3 |
RELIANCE |
9.65 |
1,288.85 |
1,275.35 |
−1.05 |
| 4 |
BHARTIARTL |
6.22 |
1,950.05 |
1,931.15 |
−0.97 |
| 5 |
LT |
5.34 |
3,816.85 |
3,793.60 |
−0.61 |
| 6 |
SBIN |
4.70 |
1,025.35 |
1,012.85 |
−1.22 |
| 7 |
AXISBANK |
4.25 |
1,239.75 |
1,222.95 |
−1.36 |
| 8 |
INFY |
3.85 |
1,052.30 |
1,051.80 |
−0.05 |
| 9 |
KOTAKBANK |
3.19 |
381.80 |
383.45 |
+0.43 |
| 10 |
ITC |
3.05 |
280.80 |
281.40 |
+0.21 |
| 11 |
M&M |
3.03 |
3,174.65 |
3,228.70 |
+1.70 |
| 12 |
BAJFINANCE |
2.96 |
1,060.00 |
1,039.50 |
−1.93 |
| 13 |
TCS |
2.27 |
2,208.85 |
2,242.25 |
+1.51 |
| 14 |
SUNPHARMA |
2.22 |
1,942.95 |
1,954.05 |
+0.57 |
| 15 |
ETERNAL |
2.11 |
283.40 |
286.70 |
+1.16 |
| 16 |
HINDUNILVR |
2.09 |
2,158.00 |
2,160.70 |
+0.13 |
| 17 |
MARUTI |
2.01 |
13,546.50 |
13,396.05 |
−1.11 |
| 18 |
TITAN |
1.99 |
4,705.65 |
4,696.55 |
−0.19 |
| 19 |
NTPC |
1.87 |
350.55 |
348.75 |
−0.51 |
| 20 |
TATASTEEL |
1.71 |
186.50 |
184.25 |
−1.21 |
| 21 |
BEL |
1.63 |
406.80 |
405.30 |
−0.37 |
| 22 |
ADANIPORTS |
1.48 |
1,819.35 |
1,778.30 |
−2.26 |
| 23 |
ULTRACEMCO |
1.47 |
11,876.50 |
11,930.00 |
+0.45 |
| 24 |
POWERGRID |
1.44 |
288.30 |
289.80 |
+0.52 |
| 25 |
INDIGO |
1.33 |
5,120.65 |
5,023.90 |
−1.89 |
| 26 |
ASIANPAINT |
1.32 |
2,693.05 |
2,669.00 |
−0.89 |
| 27 |
HCLTECH |
1.25 |
1,237.55 |
1,244.85 |
+0.59 |
| 28 |
TRENT |
1.19 |
2,887.55 |
2,874.10 |
−0.47 |
| 29 |
BAJAJFINSV |
1.10 |
1,883.40 |
1,889.35 |
+0.32 |
| 30 |
TECHM |
0.98 |
1,557.55 |
1,554.00 |
−0.23 |
|
Total |
100.00 |
|
|
|
6. The Calculation (step by step)
- For each stock compute
weight × (price_today / price_yesterday).
Example — HDFCBANK: 0.1342 × (748.00 ÷ 753.15) = 0.133283
- Sum all 30 terms → Σ = 0.994917
- Multiply by the anchor:
Index_23Jul = 76,755.05 × 0.994917 = 76,384.86
7. Result
|
Value |
| Calculated close |
76,384.86 |
| Actual BSE close |
76,391.39 |
| Difference |
−6.53 pts |
| % error |
−0.0086% |
Independently reproduced to within 0.0086% — using only the anchor, your weightage, and two days of prices, with the Divisor and IWF never required directly (they cancel via the weights).
8. Why It’s Not Exact to the Last Paisa
Weights are a vendor free-float reconstruction, not BSE’s exact proprietary Shares Outstanding × IWF product.
These are data-source accuracy limits, not formula or precision limits. Closing the last few points needs BSE’s two entitlement-only inputs: the exact IWF (or index shares) and the exact official closing prices.
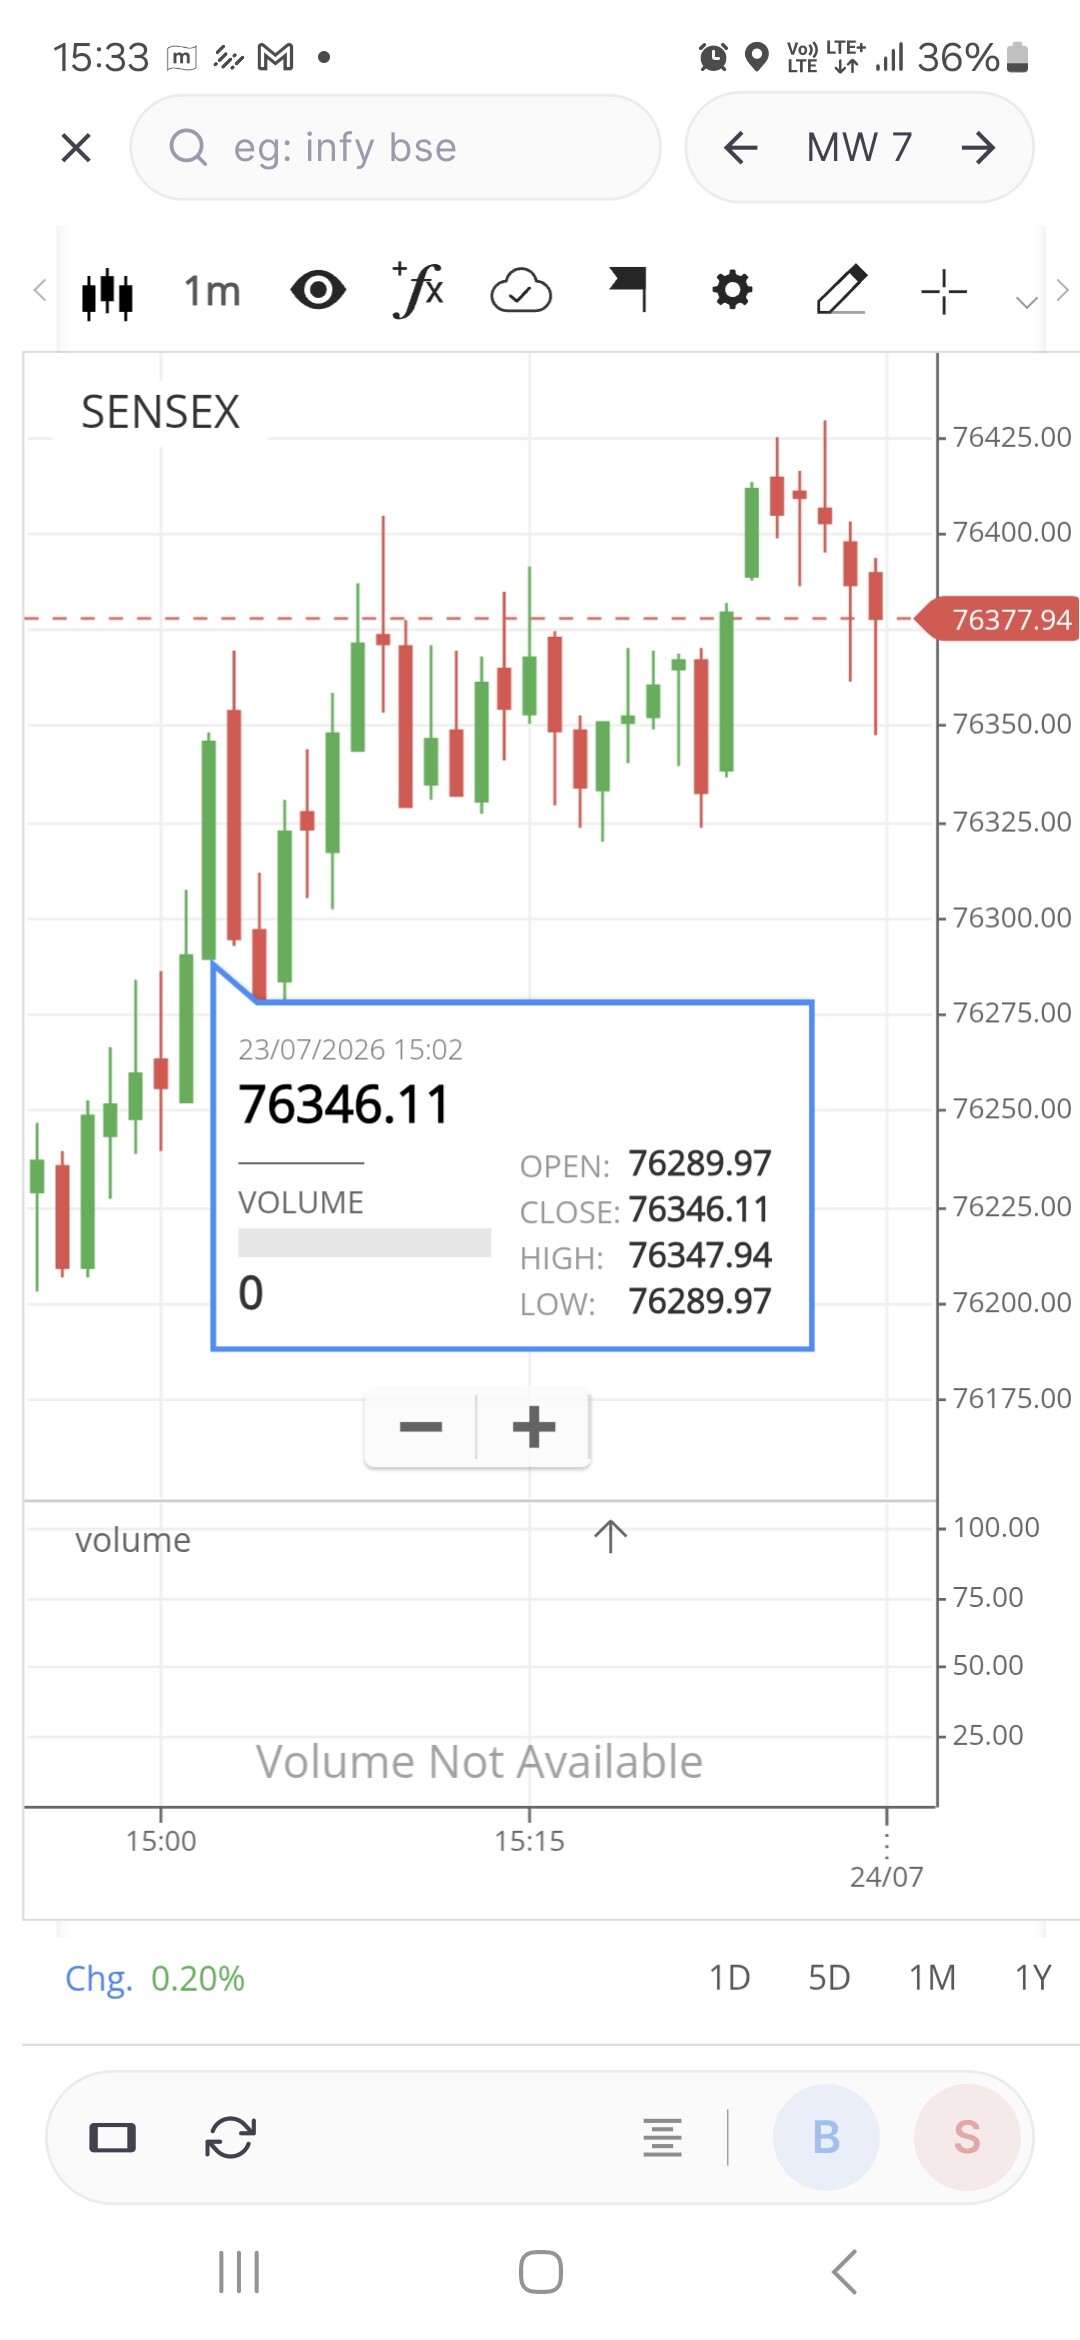
 Calculating the Sensex Close — Full Reference