I created long strangle of monthly options in nifty. aimed for intraday gains.
The graph in Sensibull shows 0 loss if it just moves even 10-20 points also. else no profit no loss.
But since the time I entered this trade, its in loss. Isn’t sensibull considering greeks properly. is the data inaccurate ?
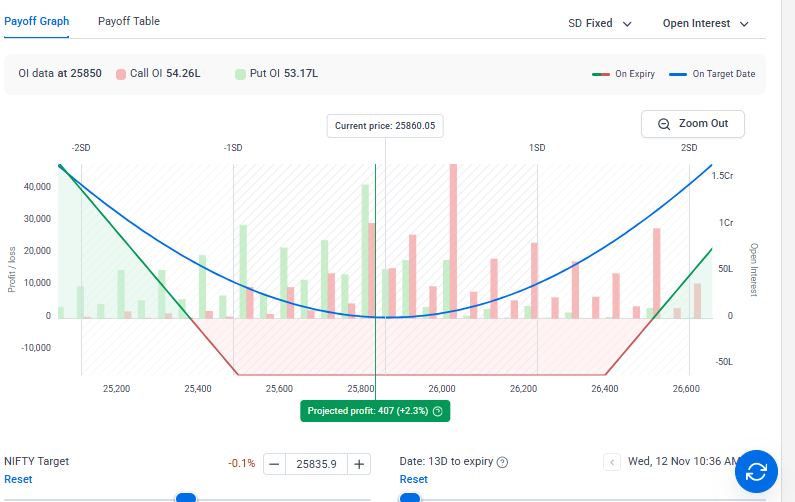
Can you give me the full screenshot? Are you analysing your positions? Or are you analysing a new trade?