Hi I used the options payoff chart from sensibull to create a strategy for live deployment.
On the day of deployment the max loss indicated was only Rs300. However the next day the max loss shifted to Rs 6000. Now after 4 days the max loss is showing Rs 30000
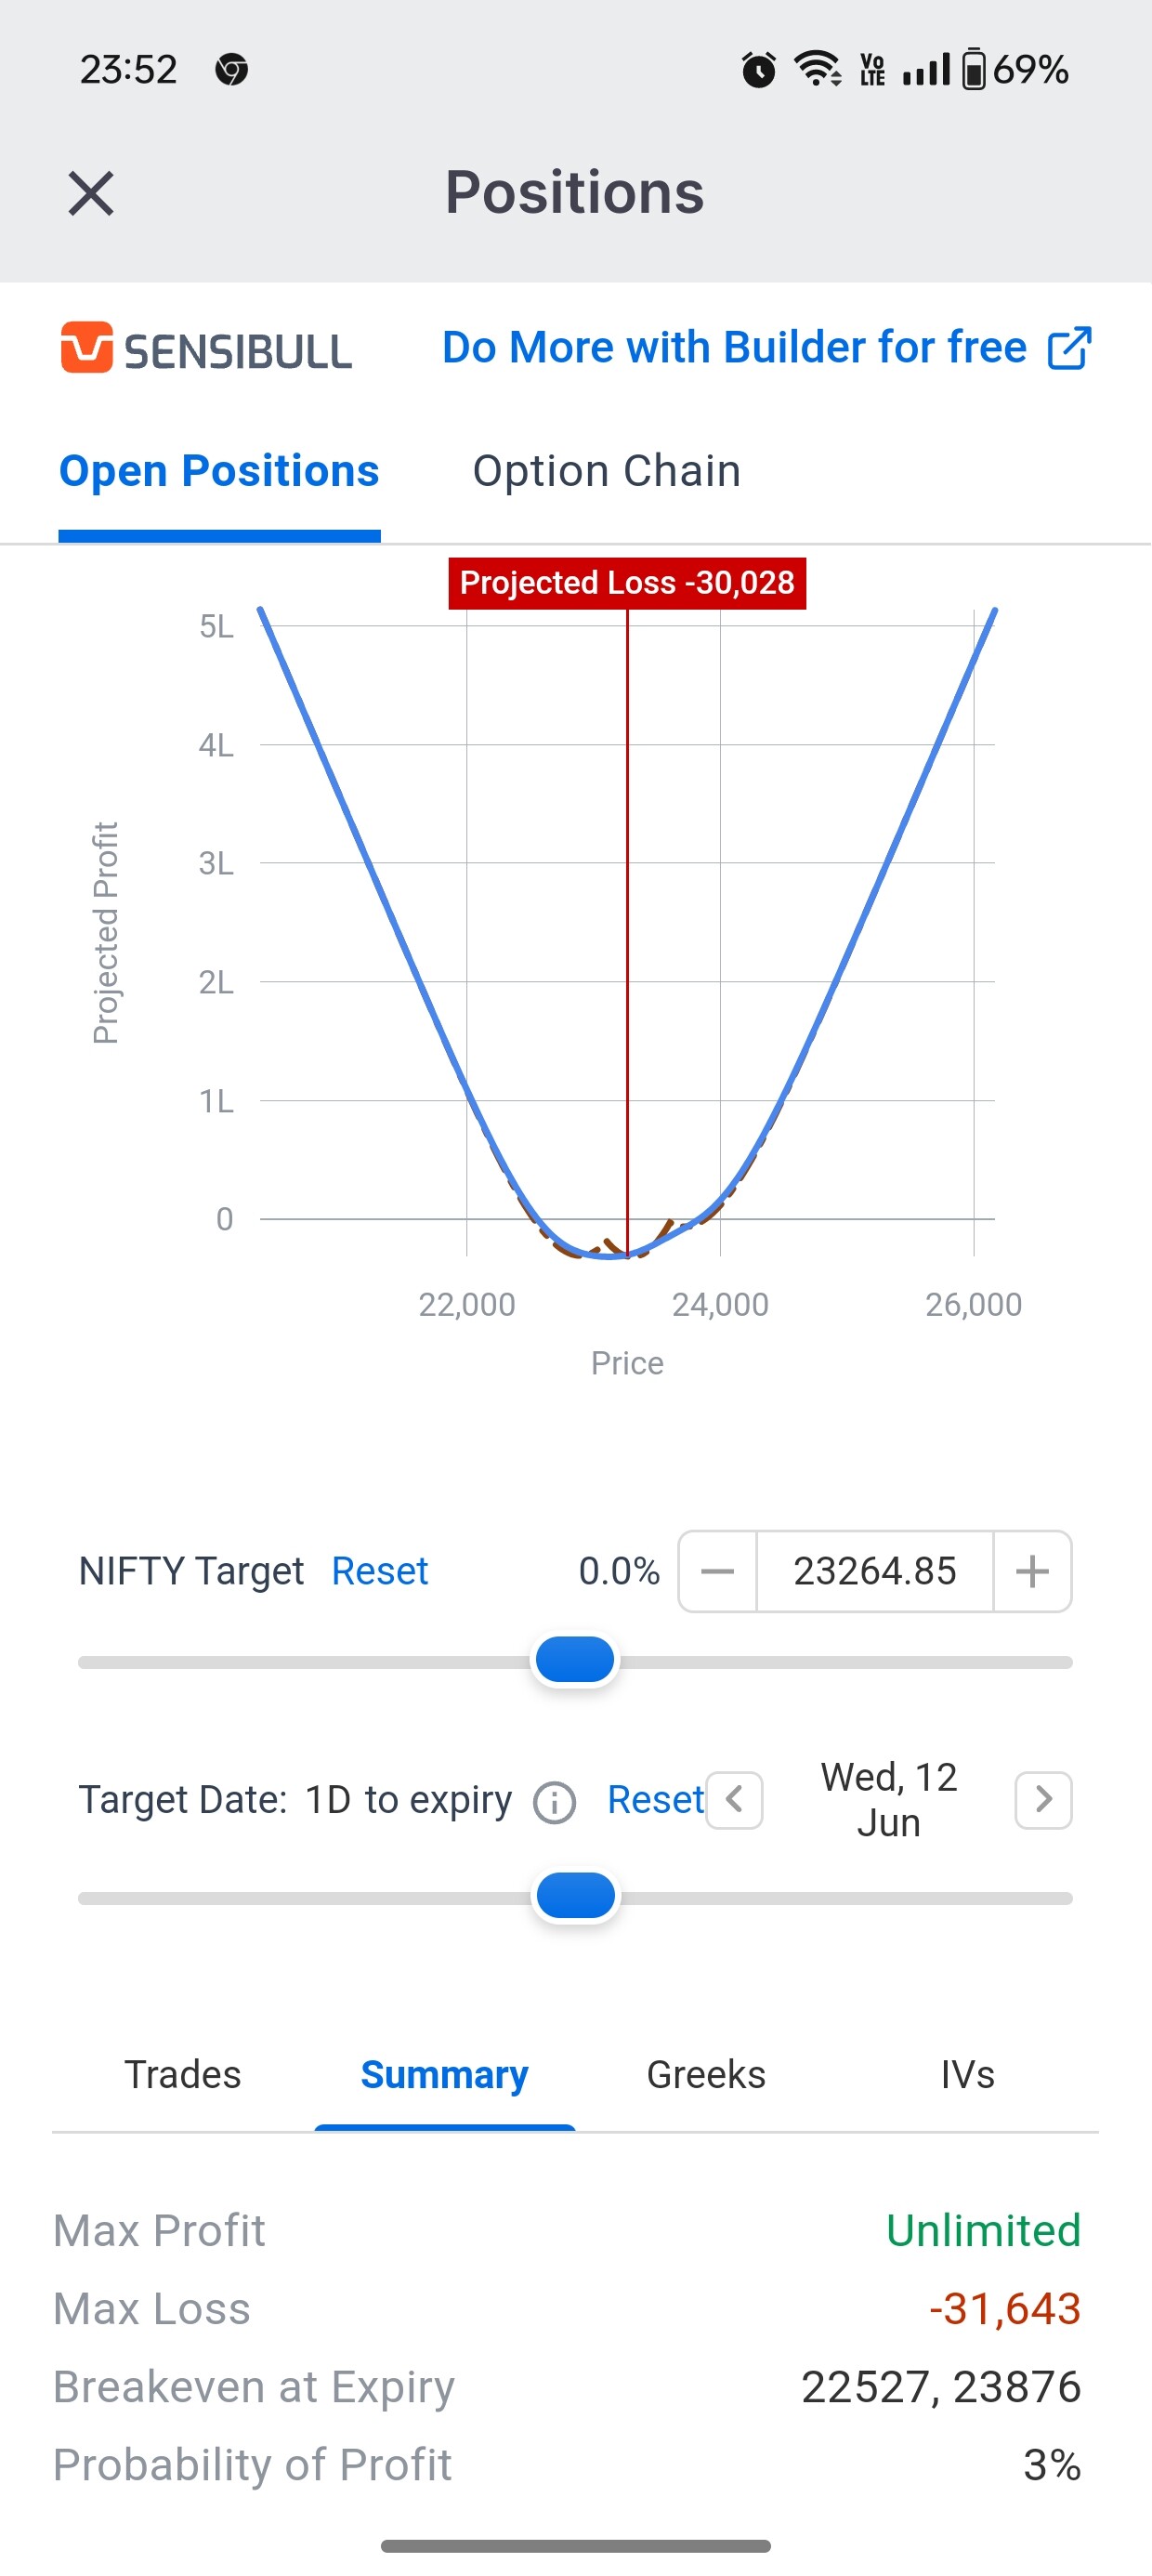
I used a calender spread…
The payoff chart looks similar in structure but on successive days the complete chart seems to move down in the negative side.
I don’t understand if I am doing something wrong