I would like to know is there any website from where I can get the share price of a stock in 1992 August ?
I checked NSE & few other websites, but was unable to get that data. If anyone is aware, do let me know.
I would like to know is there any website from where I can get the share price of a stock in 1992 August ?
I checked NSE & few other websites, but was unable to get that data. If anyone is aware, do let me know.
See the charts bro you will get the data
Can you be specific which chart provides 1992 data ???
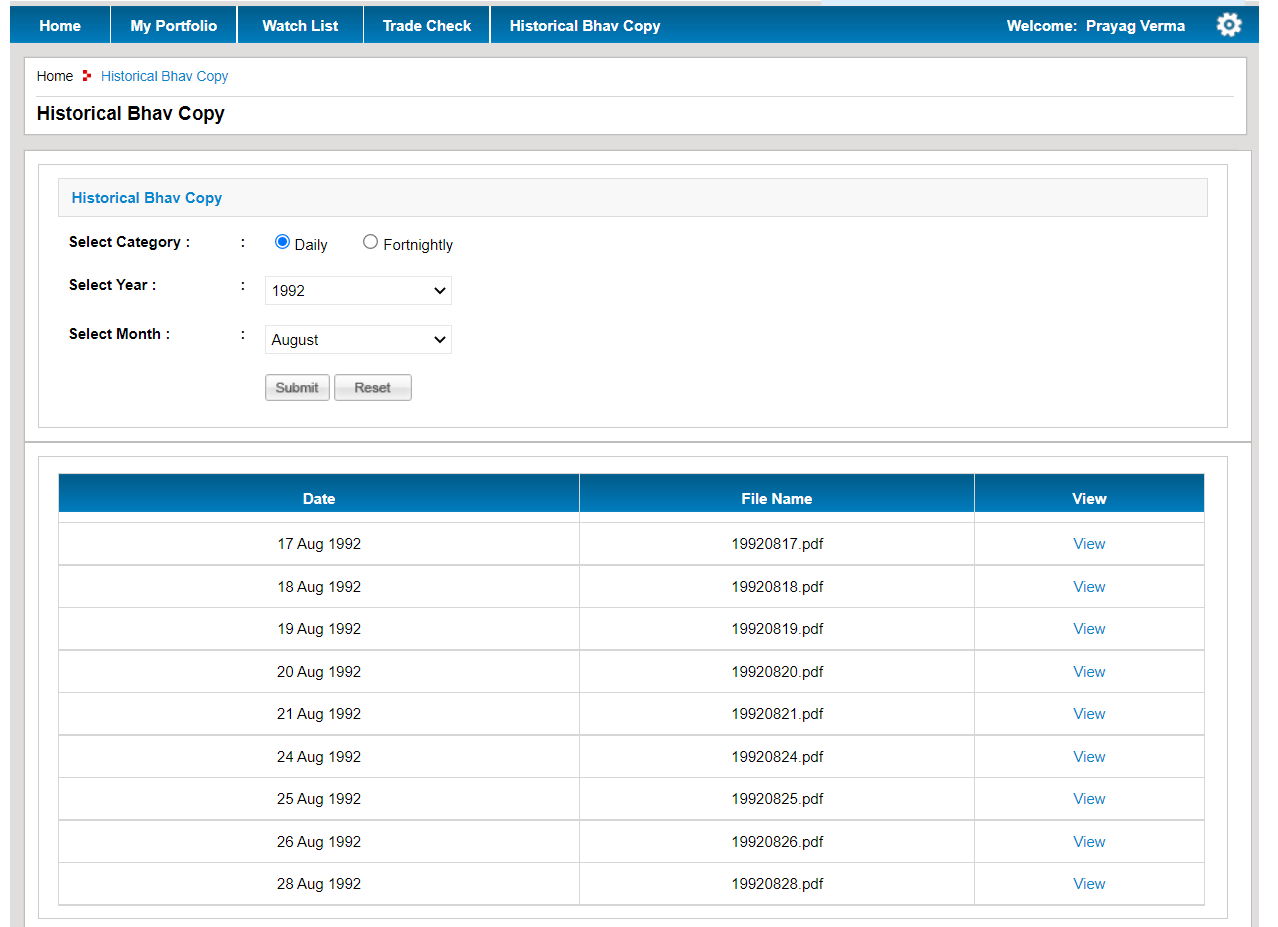
You could get this data on BSEPlus website. It will require free registration before you can access it (under the Historical Bhav Copy section).
It has data starting from 1959 but the format might be a little hard to read (but the text is searchable in these Bhavcopies)
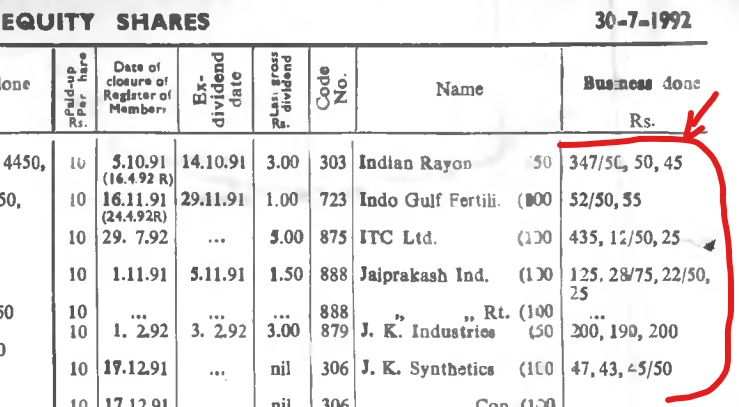
@Prayag thanks this looks promising. By any chance would you know how to interpret the Business done column (Screenshot attached). I thought it is OHLC, but it does not give 4 values for all shares.
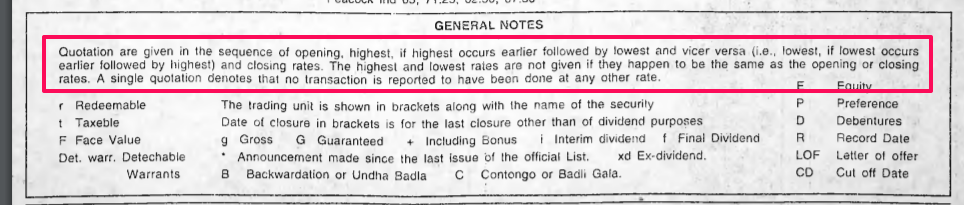
According to the explanation given below in those old Bhavcopies, the Business done section contains the opening rate, the highest rate for the day, the lowest rate of the day (the order of highest and lowest rate can change based on which price the stock traded first at), and closing rate.
This explains the 4 prices that some of the stocks have - Opening Rate, Low/High of the day, High/Low of the day, Closing Rate. From what I understood, if the highest and lowest rates are the same during the day, then they are mentioned only once (so there would be 3 prices in that case). Also if the highest and lowest price matches with the opening and closing rate, then there would be only 2 prices shown (aka only the Opening and Closing). So in the above example, if we check ITC, then it should likely mean -
Also, the figure mentioned in brackets along with the stock name is the lot size / trading unit for the stock. This would mean that ITC used to trade in 100 shares (and its multiples) at a given time back then.
The price movements in the above example are very large. But this likely has to do with the scam and few other issues during that time (For reference, check Panic struck - India Today - it contains the highs and lows for various stocks (including ITC) for the date of 6th August 1992 , around a week after the above example)
Edit - Changed the interpretation a bit upon re-checking the explanation. Mainly this is how I think these numbers should be interpreted but I cannot conclude about it decisively. If anyone else has knowledge about it, please share as well.