Hi, can anyone here please tell me how can I shift a histogram from 0 to 50 in AFL? There is “histbase” in pine-script. Is there any similar function in AmiBroker Formula Language? Thanks in advance. Regards.
There is a function called Remap in AFL
1 Like
Thanks a lot again. I got the syntax -
Remap( value, srcMin, srcMax, dstMin, dstMax )
But can’t manage to use it properly.
Remap(hist, 0, 100, 50, dstmax);
Can you please suggest the value for “dstmax”?
Regards.
you have to post all the relevant code from pinescript and AFL.
describe clearly what you want.
1 Like
I am trying to code an histogram for stochastic oscillator, and place the oscillator on median i,e, 50. I have already done it in pine script. But couldn’t do so in AFL.
_SECTION_BEGIN("Stochastic Smoothed");
Periods = 10;
c1 = 1.41421 * 3.14159 / Periods;
c2 = 2.71828^-c1;
a1 = 2 * c2 * cos( c1 );
a2 = -c2^2;
b0 = (1 - a1 - a2)/2;
b1 = b0;

periods = Param( "Periods", 14, 1, 200, 1 );
Ksmooth = Param( "%K avg", 1, 1, 200, 1 );
Dsmooth = Param( "%D avg", 3, 1, 200, 1 );
siglen = Param("Signal Length", 3, 1, 100, 1);

d = StochD( periods , Ksmooth, DSmooth );
esd = IIR( d, b0, a1, b1, a2 );
dsig = EMA(esd, siglen);
hist = (esd - dsig);
histscale = Param("Histogram Base", 50, 0, 100, 1);
hist_color = IIf(hist>0 AND hist>Ref(hist,-1),colorGreen,IIf(hist>0 AND hist<Ref(hist,-1),colorBlue,IIf(hist<0 AND hist<Ref(hist,-1),
			colorBrown,colorOrange)));

Plot(hist, "Histogram", color=hist_color, styleHistogram | styleThick | styleOwnScale, 50, histscale);
PlotGrid(80, colorBrightGreen, pattern=10, width=2, label=True);
PlotGrid(50, colorBrown, pattern=9, width=2, label=True);
PlotGrid(20, colorRed, pattern=10, width=2, label=True);
Plot(esd, "Stoch%D", colorBlue, styleLine | styleThick);
Plot(dsig, "Signal", colorRed, styleLine | styleThick);
_SECTION_END();
The code for the stochastic oscillator. The Histogram needs to be on the median. The value of the median is 50/
I have posted the code. Please check. Thanks & regards.
is this code going to be used with Pane having Price etc or you will put the code in a separate chart pane?
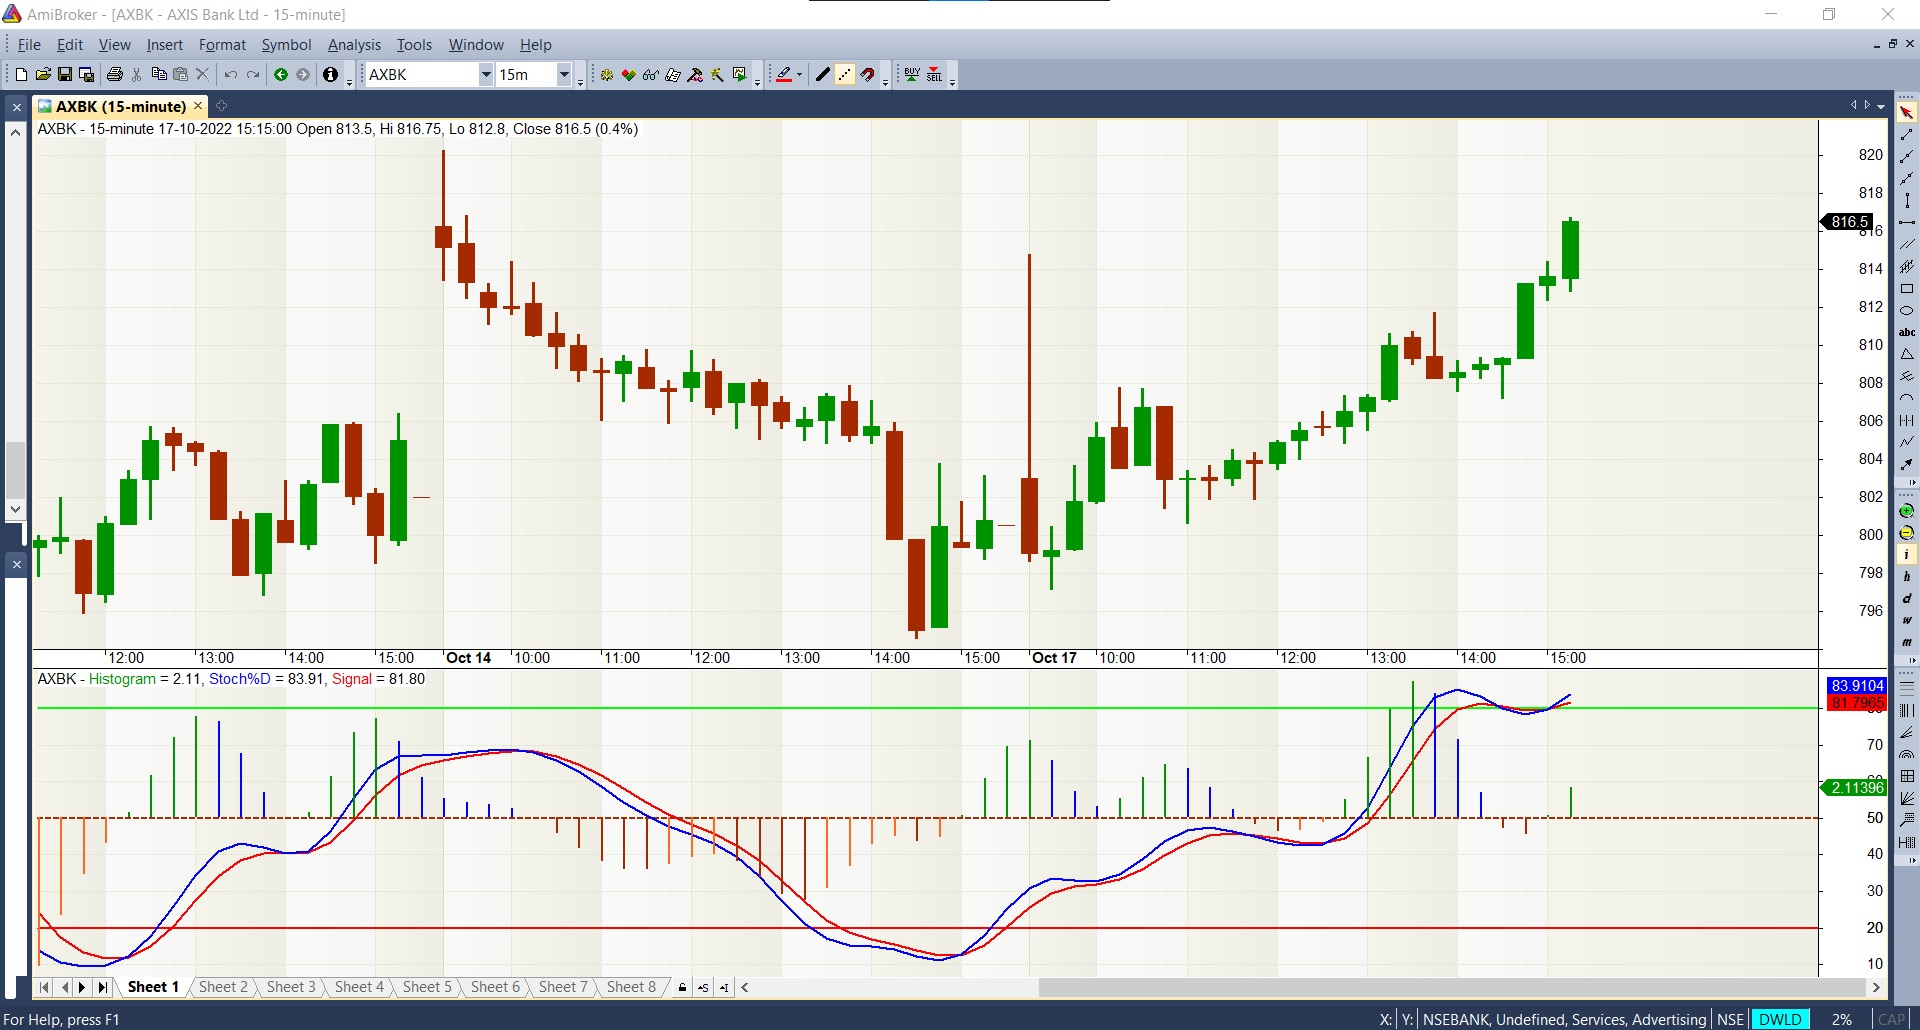
This is how I need it. Also, if there is a way to make the histogram columns a bit more fatter, that would be very nice. Thanks.
_SECTION_BEGIN("Stochastic Smoothed");
Periods = 10;
c1 = 1.41421 * 3.14159 / Periods;
c2 = 2.71828^-c1;
a1 = 2 * c2 * cos( c1 );
a2 = -c2^2;
b0 = (1 - a1 - a2)/2;
b1 = b0;

periods = Param( "Periods", 14, 1, 200, 1 );
Ksmooth = Param( "%K avg", 1, 1, 200, 1 );
Dsmooth = Param( "%D avg", 3, 1, 200, 1 );
siglen = Param("Signal Length", 3, 1, 100, 1);

d = StochD( periods , Ksmooth, DSmooth );
esd = IIR( d, b0, a1, b1, a2 );
dsig = EMA(esd, siglen);
hist = (esd - dsig);
hist_color = IIf(hist>0 AND hist>Ref(hist,-1),colorGreen,IIf(hist>0 AND hist<Ref(hist,-1),colorBlue,IIf(hist<0 AND hist<Ref(hist,-1),
			colorBrown,colorOrange)));


Plot(esd, "esd", colorBlue, styleLine);
Plot(dsig, "dsig", colorRed, styleLine);
PlotGrid(80, colorBrightGreen, pattern=10, width=2, label=True);
PlotGrid(50, colorBrown, pattern=9, width=2, label=True);
PlotGrid(20, colorRed, pattern=10, width=2, label=True);

// keep (-10,10). To decrease bar size try (-20,20)
Plot(hist, "Histogram", color=hist_color, styleHistogram | styleThick|styleOwnScale|styleNoLabel,-10,10);

// Dont change values. Used to fix rescaling
Plot(110, "", colorWhite,styleLine|styleNoDraw|styleNoLabel);
Plot(-15, "", colorWhite,styleLine|styleNoDraw|styleNoLabel);

_SECTION_END();
1 Like
You are “THE AFL GOD”. Thanks a lot again. Truly. With Love and Respect.
1 Like
AFL god is actually Tomasz who built it from scratch ![]()
If you’re new and learning, buy the License and support the software.
1 Like
You are THE DEMI-GOD then. I have a pine script that I am looking forward to code in AFL. But like the rest of my preferred tools it’s not easy to code in AFL at least with my level of expertise, which is obviously even less than a novice. If you are willing to take upon the heavy task, and ready for the challenge I can share you the pine-script through email. Trust me, it’s a highly accurate interpretation, particularly for day traders. Please share your email if you are willing to give it a look at least. Thanks and regards.
Yes I am planning to do so after the completion of coding all the tools in AFL from Pine-Script, those I use regularly. And I am almost done.