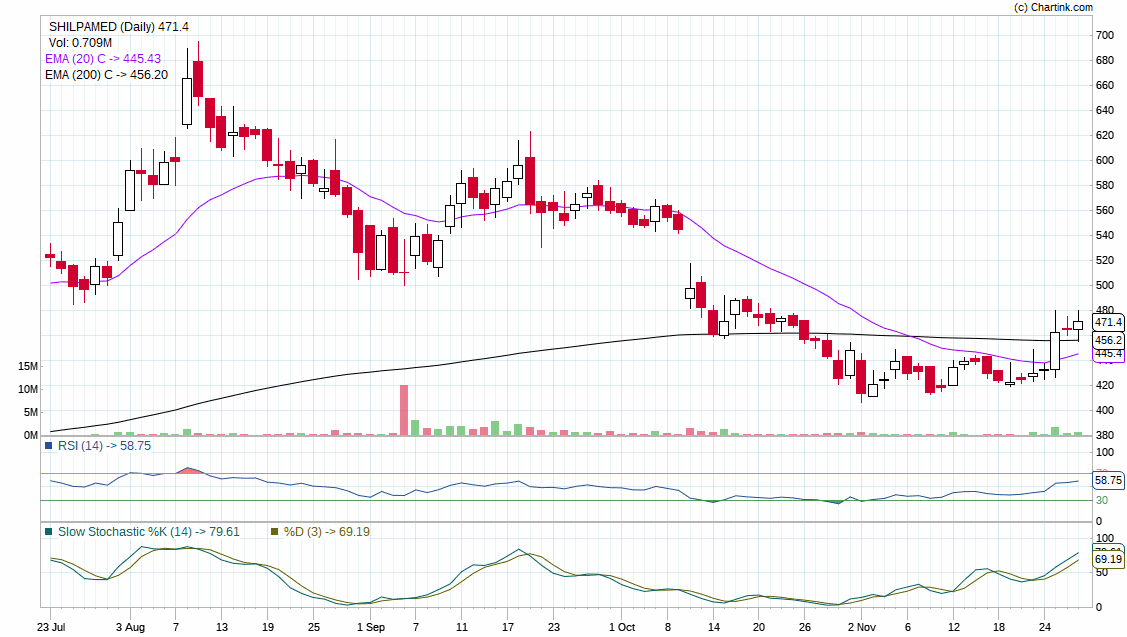
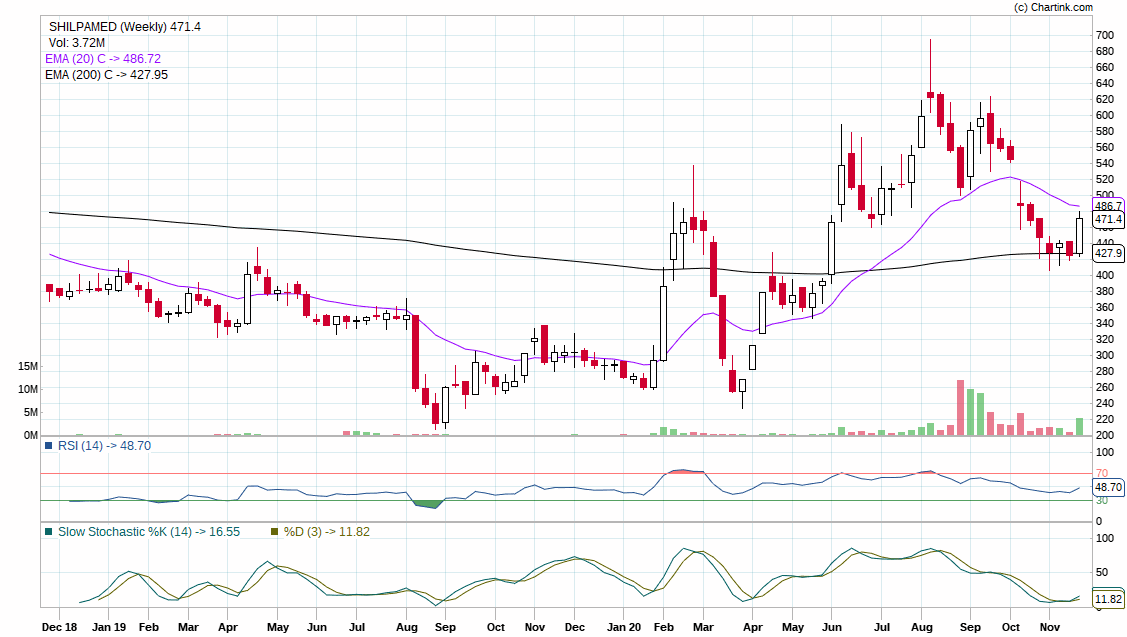
As a season of the stock like many pharma stocks , this one technical chart is interesting , moving up with good volumes , just for the analysis , Shilpa Medicare is closed above 20& 200EMA, on daily chart & on weekly chart also it has taken support & bounced from 200 EMA and made “W” format , a sign of of bullishness. Lets share your TA analysis, will it sustain the up-move?
1 Like