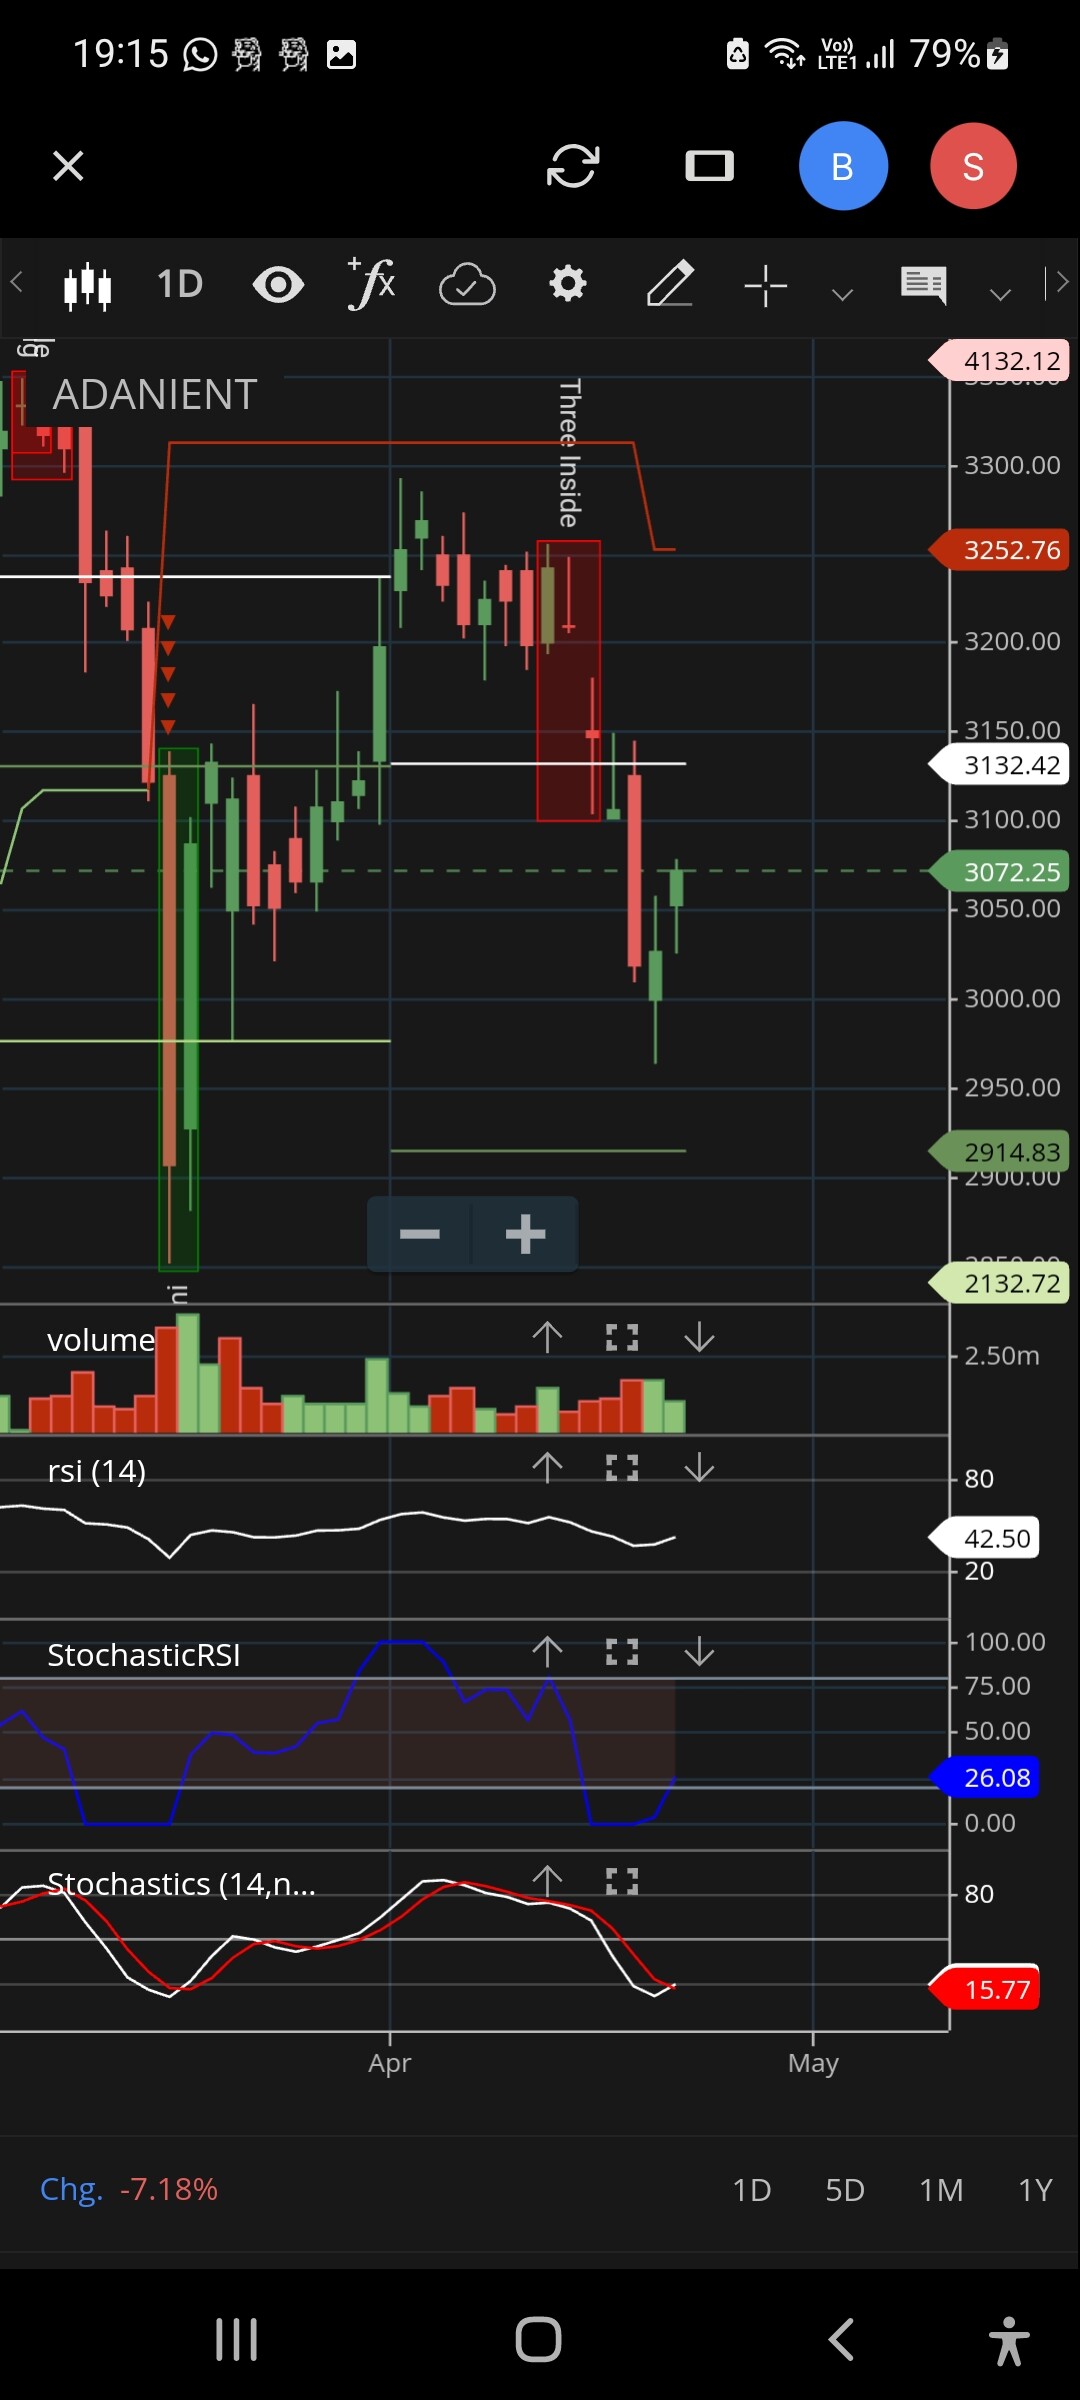
In TV stochastic RSI is shown correctly with %K & %D lines but in IQ Chart only single line is shown. Why this is difference? This is incorrectly shown. Didn’t understand the logic behind this. People who r trading short periods with this indicators may not get correct signals. With other indicators combination of this can be used in IQ Chart.
We are currently investigating the query mentioned above and will provide a prompt response. Your cooperation in this matter is greatly appreciated.
For options price on daily chart, why stochastic RSI is not showing. It is seen on minutes, hourly chart but not on daily to monthly chart

To view the indicator, there should be a sufficient amount of candle data.
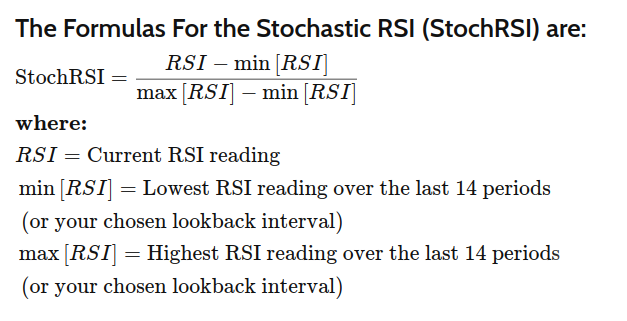
Chartiq follows this formula